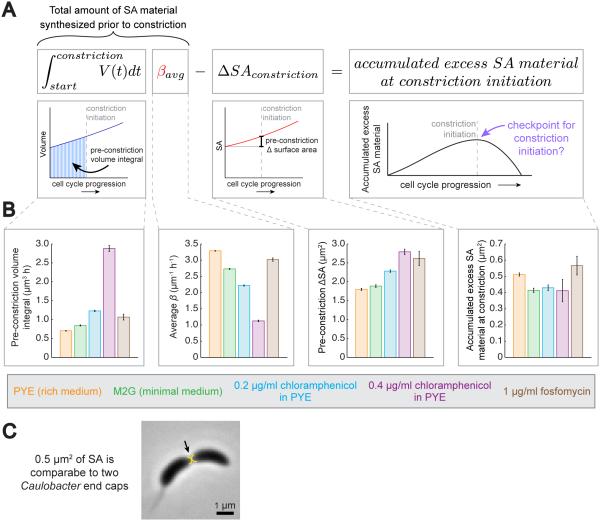
Figure 7. Accumulation of a Threshold Amount of Excess SA Material Could Trigger Constriction Initiation.
A. Mathematical framework for estimating the amount of excess SA material accumulation prior to constriction. βaverage is used to approximate the underlying rate of SA production per unit volume. See also Figures S5 and S6.
B. Bar graphs showing the average values for the measured quantities used to estimate the amount of excess SA material accumulated prior to constriction initiation according to the framework in (A), as well as average values for the estimated accumulated material at constriction. N>19 cell cycles per bar. Error bars = SEM.
C. Representative image of a dividing C. crescentus cell overlaid with two semi-circles representing hemispheres whose SA adds up to 0.5 μm2.

