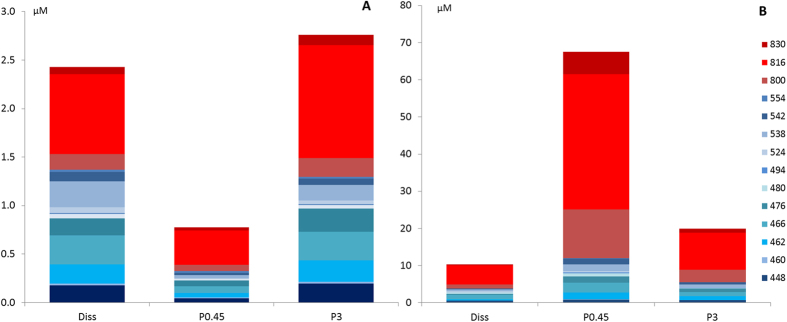
Figure 2.
Amount of each targeted metabolite (μM) in the exometabolome, (A) for natural samples and (B) for stressed samples. (Diss): dissolved form, (Porosity of the filter in μm): particulate forms. The number associated to each color corresponds to the molecular mass (M) of each targeted specialized metabolites (see Table 2).

