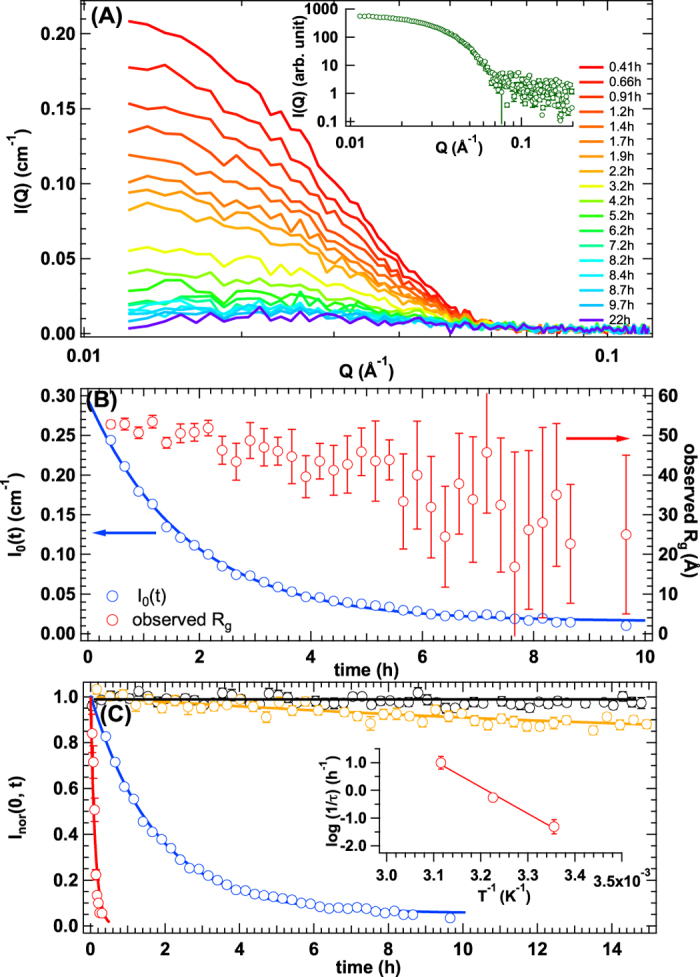
Figure 2.

(A) Time evolution of small-angle neutron scattering profiles after mixing d-αB and h-αB in the inverse contrast solvent at 37 °C (red to purple lines correspond to 0.41 h to 22 h), and inset indicates small-angle X-ray scattering profile measured at 22 h after mixing d-αB and h-αB in the inverse contrast solvent at 37 °C. (B) Time dependence of I0 (blue circle) and observed Rg (red circle). The solid line corresponds to the result of fit with eq. (2). The direction and colour of arrows highlight the proper vertical axis for I0(t) and Rg, respectively. (C) Time evolution of I0_nor(t) at 10 °C (black circle), 25 °C (yellow circle), 37 °C (blue circle), and 48 °C (red circle). The yellow, blue, and red curves correspond to the result of fit with eq. (2). Black line is guided by eye. Inset indicates Arrhenius plots of the relaxation rates.
