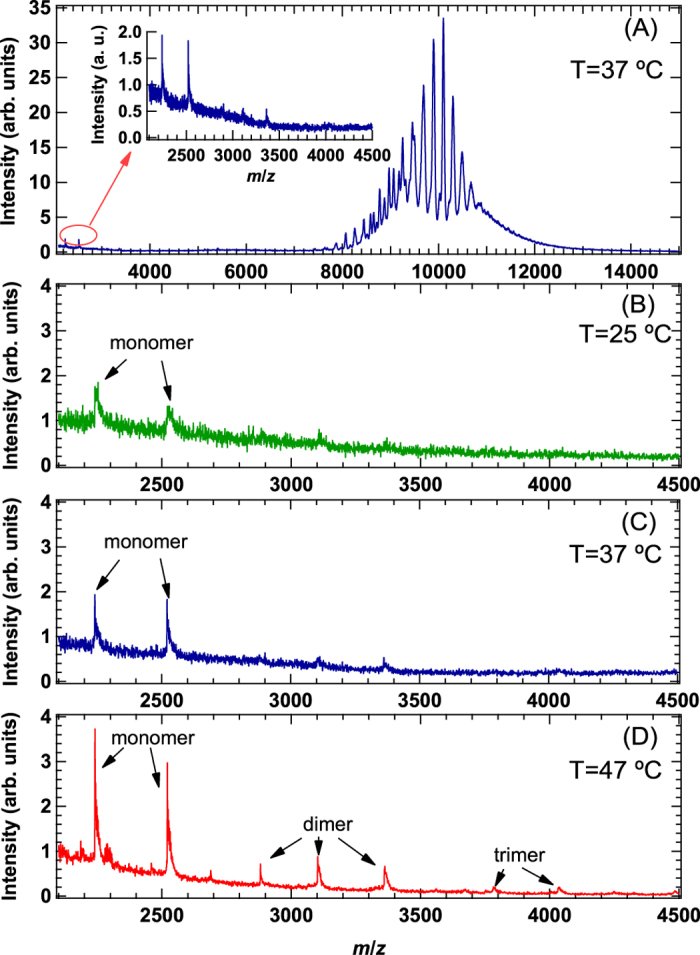
Figure 3.

(A) Mass spectrum of αB-crystallin oligomer at 37 °C, and inset indicates the magnified spectrum at low m/z region ranging from 2100 to 4500. (B) Mass spectrum measured at 25 °C at low m/z region ranging from 2100 to 4500. (C) Mass spectrum measured at 37 °C at low m/z region ranging from 2100 to 4500. (D) Mass spectrum measured at 47 °C at low m/z region ranging from 2100 to 4500.
