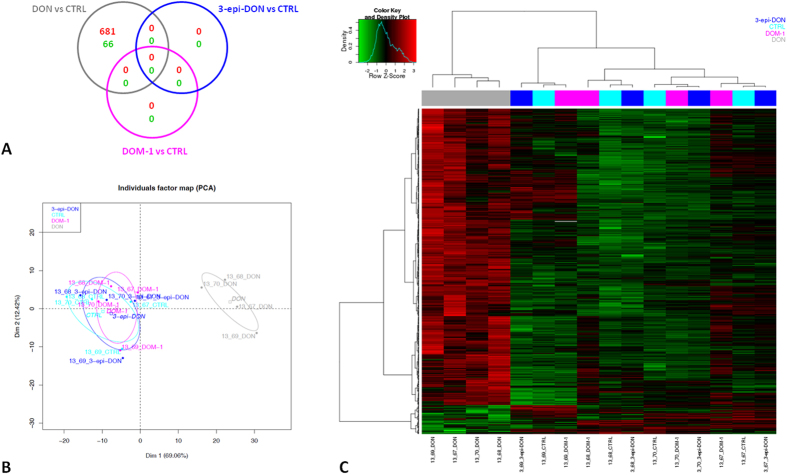
Figure 3. Gene expression profile of intestinal explants exposed to deepoxy-DON, 3-epi-DON or DON.
Jejunal explants from 4 different animals were exposed for 4 hours, to diluent or 10 μM toxins and gene expression was analyzed with a 60 K microarray. (Panel A): Venn diagram illustrating the overlaps between the probes significantly up- or down-regulated in response to DON, deepoxy-DON (DOM-1) and 3-epi-DON treatment. (Panel B): Principal Component Analysis of differentially expressed probes between DON, deepoxy-DON (DOM-1), 3-epi-DON and control (747 with BH adjusted p-value < 0.05). (Panel C): Heat map representing differentially expressed probes between DON, deepoxy-DON (DOM-1), 3-epi-DON and control explant. Red and green colors indicate values above and below the mean (average Z-score) respectively. Black color indicates values close to the mean.

