
Fig. 3.
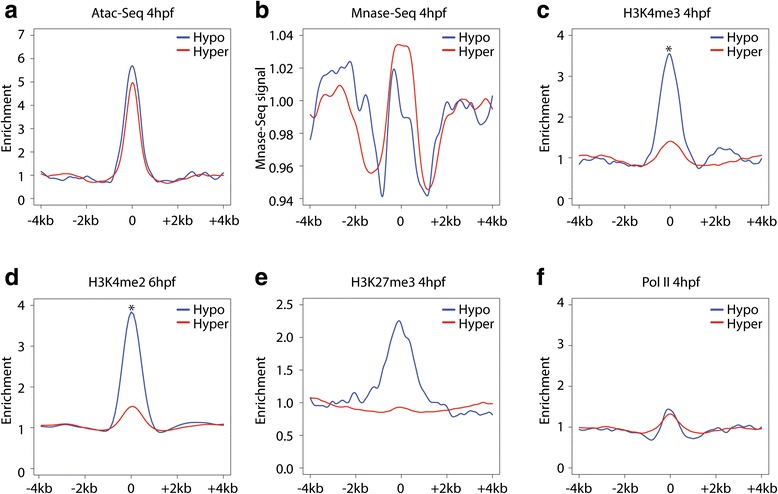
Hypo-enhancers have a unique epigenetic environment. a–f Profiles of Atac-Seq, Mnase-Seq, H3K4me2/3, H3K27me3, and Pol II ChIP-Seq over hypo- and hyper-enhancers. The enrichment (y-axis) of the various epigenetic marks is plotted over a region of 4 kb up- and downstream of the middle points of the two enhancer types