
Fig. 4.
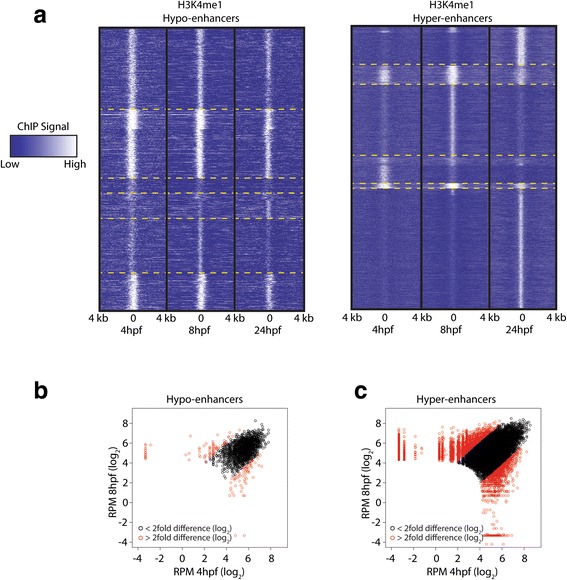
Hypo-enhancers are stable throughout zebrafish development. a Heat map displaying RPM-normalized H3K4me1 intensities of all hypo- and hyper-enhancers called throughout the first 24 h of development. The heat map was clustered using k-means clustering (n = 6). Yellow dashed lines indicate cluster transitions. b, c Dynamics of H3K4me1-normalized read density of hypo- and hyper-enhancers at 4 and 8 hpf. Red circles indicate peaks where the normalized read density changes more than fourfold between the two time points. Black circles indicate peaks where the normalized read density changes less than fourfold between the two time points