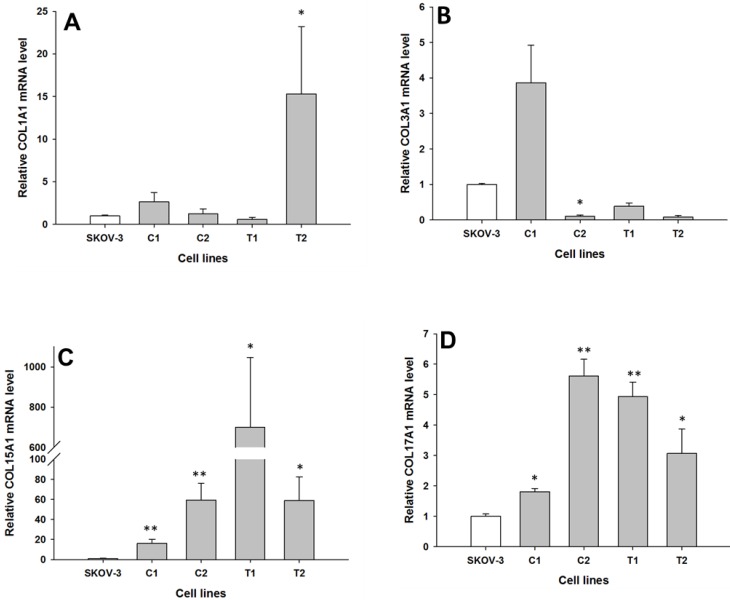
Figure 3.
Expression analysis (Q-PCR) of COL1A1 (A), COL3A1 (B), COL15A1 (C) and COL17A1 (D) genes in SKOV-3 and its drug resistant sublines. The figure presents the relative gene expression of resistant cell lines (grey bars) with respect to the SKOV-3 cell line (white bars), which is assigned a value of 1. Values were considered statistically significant at p<0.05*, p<0.01**.

