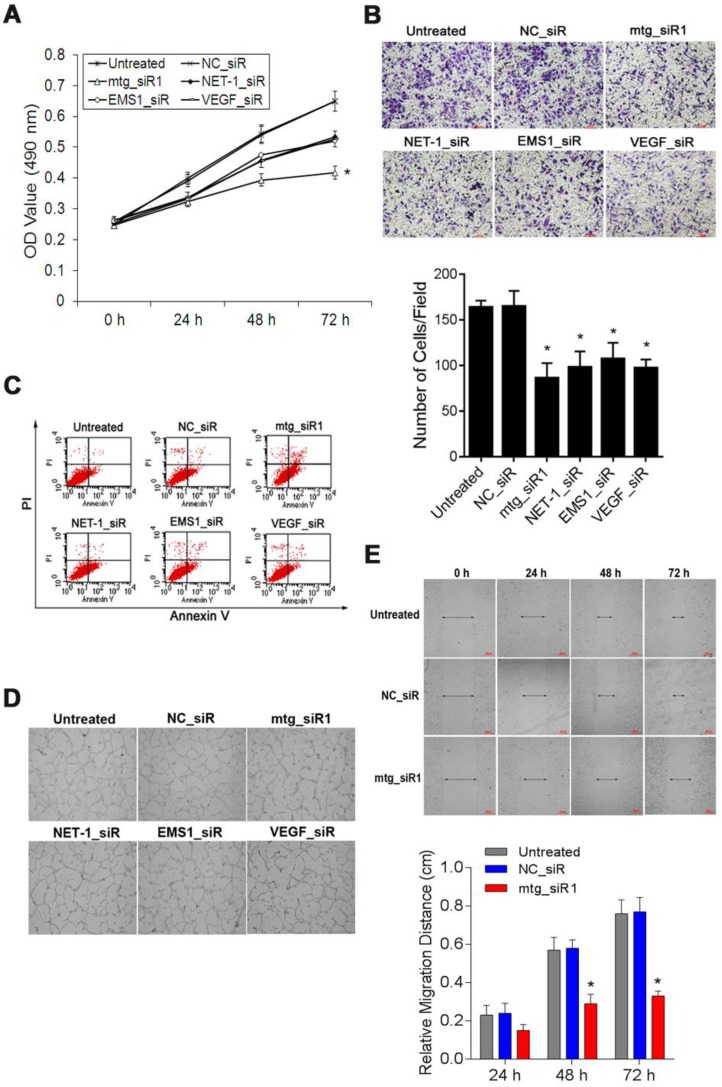
Figure 8.
The suppression effects on cell viability, invasion, angiogenesis, migration and induced apoptosis by mtg_siR. (A) Cell growth curve of all groups at 0 h, 24 h, 48 h, 72 h, (B) Representative field photograph of transwell chamber assay under single-target siRNA and mtg_siR treatment after 48 h, (C) Cell apoptosis was measured by FCM analysis after AnnexinV/PI staining, (D) The tube formation photographs of each treatment in HUVECs angiogenesis model, (E) The ability of cell migration at 0 h, 24 h, 48 h, 72 h.

