Figure 4.
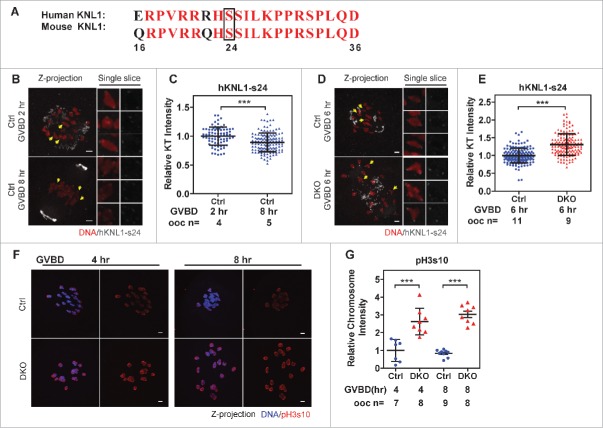
Phosphorylation of hKNL1-ser24 and pH3s10 were increased DKO oocytes. A polyclonal antibody recognizing the phosphorylated ser24 in hKNL1 protein (hKNL1-ser24) of KMN network has been developed based on the human protein sequences by Iain M.Cheeseman's group. (A) Similarity of the immunogenic peptide sequences of hKNL1-ser24 was compared between human and mouse. Identical residues are indicated in red font. The black box marks the Serine 24 phosphorylation site. (B) Feasibility of the antibody was evaluated in Ctrl oocytes. Ctrl oocytes were fixed at 2 h or 8 h after GVBD and immunostained for DNA and hKNL1-ser24. Representative z-projected images are shown in the left. Magnified views of the single chromosomes, indicated by the yellow arrows, from single slices are shown in the right panels. Note that the anti-hKNL1-ser24 antibody also targeted in the area of MTOCs. Bar = 5 μm. (C) The anti-hKNL1-ser24 antibody is feasible for immunostaining mouse oocytes. Intensities of hKNL1-ser24 signals on KTs were normalized to the average of Ctrl oocytes at GVBD 2 h and plotted (mean ± SD bars are shown). Numbers of oocytes used for analysis are indicated. Representative result from 3 independent experiments. (D) Oocytes were fixed at 6 h after GVBD and immunostained for DNA and hKNL1-ser24. Z-projected images of all the chromosomes are shown in the left panel. Magnified views of the representative single chromosomes, indicated by the yellow arrows, from single slices are shown in the right panels. Bar = 5 μm. (E) The intensities of the hKNL1-ser24 signal on KTs were normalized to the average intensity of Ctrl oocytes at GVBD 6 h and plotted (mean ± SD bars are shown). The numbers of oocytes used for analysis are indicated. Representative result from 3 independent experiments. (F) Oocytes were immunostained for DNA and pH3s10 at 4 h and 8 h after GVBD. Z-projected images of all the chromosomes are shown. Bar = 5 μm. (G) The intensities of pH3s10 signal on Chromosome clusters were normalized to the average intensity of Ctrl oocytes at GVBD 4 h and plotted (mean ± SD bars are shown). Representative result from 2 independent experiments. Statistics: ***, P < 0.001.

