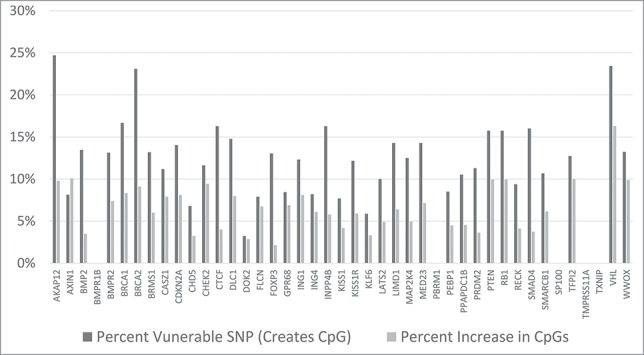
Figure 5.

Bar-graph of the tumor suppressor set comparing the vulnerable SNP percentages and the CpG dinucleotide percent changes across all CpG Islands for the indicated genes. Further detail is present in the SOM file labeled, “Samy et al. SOM, Tumor Suppressor Gene Analysis.” Also, the distance of each CpG island containing a SNP, to the start site of transcription for each tumor suppressor gene, is provided in the SOM file labeled, “Samy et al. SOM, Transcription start site, CpG island distances.”
