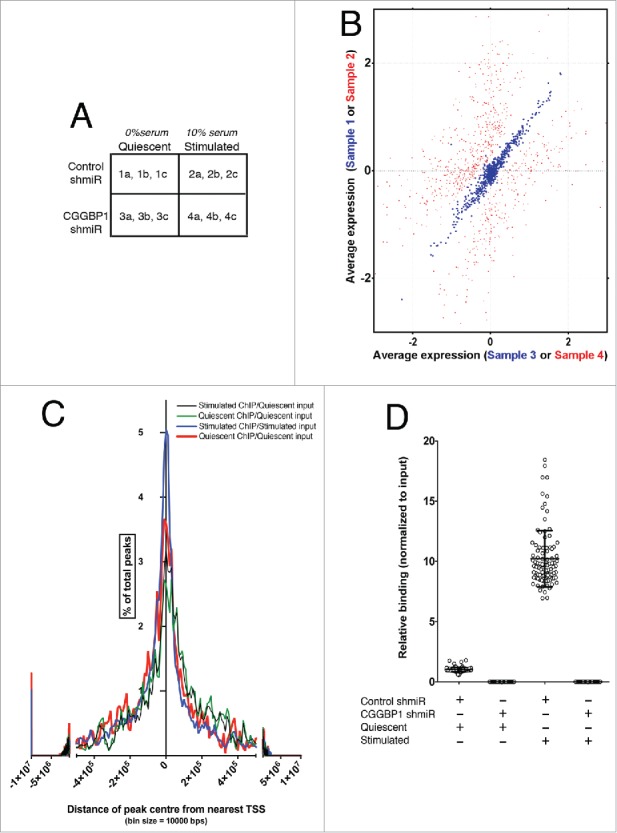
Figure 1.

Serum stimulation affects gene expression regulation by and DNA-binding pattern of CGGBP1. (A) A matrix describing the sample treatments and nomenclature. The alphabets “a," “b” and “c” denote technical replicates for each sample derived from a pool of 5 biological and experimental replicates. (B) Correlation plot showing lack of co-variability in expression values of CGGBP1-and-serum co-regulated genes between samples 2 and 4 (red spots, r2 = 0.444, Fisher test F = 0.804) and very high co-variability in expression values of CGGBP1-serum affected genes between samples 1 and 3 (blue spots, r2 = 0.995, Fisher test F = 3.405). Data are from mean expression values from 3 technical replicates of 5 pooled biological and experimental samples. (C) Frequency distribution of CGGBP1-ChIP-seq peaks in relation to the TSS of nearest protein-coding/non-coding genes. Percent of total number of peaks is shown on Y-axis and distance from TSS on X-axis. The summit shows an enrichment of genes around the TSS, although the long units on X-axis means that these distance are still very large. (D) ChIP qPCR showing the specificity of (by using shRNA-knockdown) and changes in the binding (upon serum-stimulation) of CGGBP1 to ChIP-seq peaks. Increase in binding in Stimulated over Quiescent is highly significant (T-test, p = 3.785E-60). Different data points represent one peak randomly chosen from each chromosome (n = 23 × 4 replicates).
