Figure 2.
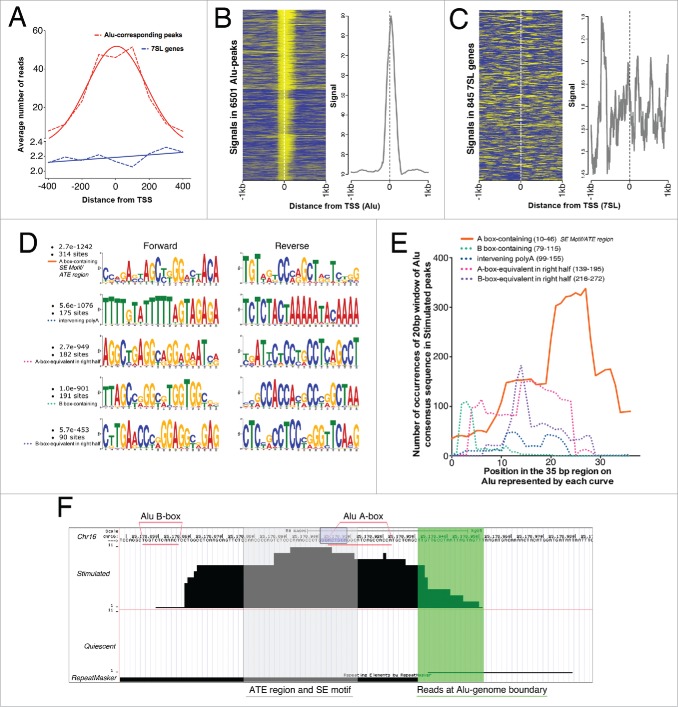
CGGBP1 shows enhanced binding to a specific subsequence of Alu-SINEs upon serum stimulation. (A) Distribution of reads in Alu-matching Stimulated peaks shows a binomial distribution with the reads piling up to create a consensus summit just downstream of Alu TSS (red curve). The tails of the reads-distribution curve extend into Alus and non-Alu regions showing the robustness of peak calling and general peak structure of Alu-matching Stimulated peaks. Similar analysis for 7SL (blue curve) showed much weaker read density compared to Alus and no normal distribution of the reads thereby supporting the absence of 7SL genes in Stimulated peaks. X-axis shows distance from TSS and Y axis shows number of reads per 6196 Alu-matching peaks and 845 7SL genes/pseudogenes. Broken lines connect exact values and the solid lines are the best Gaussian fit curves. (B) Distribution of signals (yellow) derived by mapping reads in unit sequences of 150 bps (mean length of sonicated DNA subjected to ChIP) in the regions −1kb to +1kb from Stimulated peak-matching Alu start sites shows clustering of signals both upstream and downstream of Alu TSS with summit just downstream of TSS. (C) Same analysis (as shown in (B) for Alu-matching peaks) for 7SL genes show scattered reads with no clear clustering pattern. The differences in the Y-axis values of graphs in (B) and (C) show the high enrichment around Alu TSS but no enrichment around 7SL TSS. Eleven Alu-peaks and 4 7SL values were removed as outliers from the analysis. Similar binding pattern of CGGBP1 on Alu and absence of specific binding on 7SL genes was observed in Quiescent sample also (not shown). (D) Counts and p values of 20 bp Alu sub-sequences in Stimulated peaks (performed on Alu-matching peaks only using MEME suite); the maximum occurrence and highest probability were both associated with the topmost sequence that matches to the most proximal A-box-containing region of Alus corresponding to SE motif and ATE region. (E) Intra-Alu distribution of CGGBP1-binding sequences as occurring in Stimulated peaks derived by counting exact matches between Alu consensus sequence and Stimulated peaks (iterative 100% match of a 20 bp window with one base shift per iteration, using MS Excel). Number of counts on Y-axis and location on Alu on X-axis is shown. The solid orange curve in (E)corresponds to the ATE region/SE motif and has significantly higher occurrence than other regions plotted in broken lines (chi square test, P < .01). (F) A representative Alu-matching Stimulated-specific peak shown with different features highlighted (Region = Chr16: 25,178,839-25,179,005; Alu repeat detected by RepeatMasker = black bar below; Region of reads mapping to non Alu region of the Alu-genome junction = highlighted in green; Region of reads corresponding to peak summit, ATE region/SE motif = shaded in gray; most commonly occurring 8bp motif GGAYTACA = purple box; A-box and B-boxes = underlined with pink; chromosomal coordinates and scale = mentioned on top).

