
Figure 3.
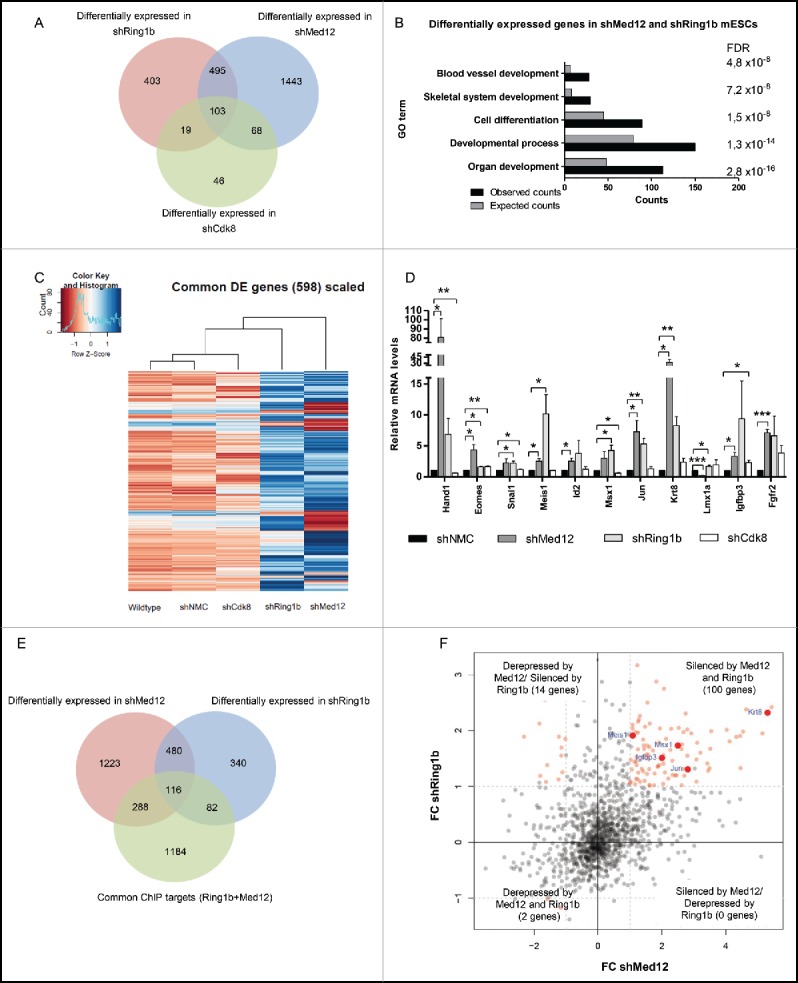
Ring1b and Med12 repress key developmental genes in mESCs. (A) Venn diagram of differentially expressed (DE) genes in control and knockdown mESCs. (B) GO analysis of biological functions of genes differentially expressed in both shMed12 and shRing1b mESCs. (C) Heatmap illustrating the expression profile of the genes differentially expressed in shMed12/shRing1b in control (shNMC), wild type, Cdk8 (shCdk8), Med12 (shMed12) and Ring1b (shRing1b) knockdown mESCs. (D) Knockdown of either Ring1b or Med12 causes de-repression of their common target genes in mESCs. Shown are the relative expression levels of selected Ring1b/Med12 target genes in the aforementioned cell lines. The relative mRNA levels are represented as fold change to the shNMC samples +/− SEM, n = 3. *** P-value< 0.0001, ** P-value < 0.001, * P-value < 0.02, as calculated by 2-tailed, unpaired t test. (E) Med12 and Ring1b directly control the expression of 116 genes. Venn diagram illustrating the overlap between differentially expressed genes in shMed12 and shRing1b mESCs and their common ChIP targets (Fig. 1A- 1670 genes). (F) Med12 and Ring1b repress the common target genes in mESCs. The plot depicts the expression Fold Change (FC) of the 116 direct target genes (Fig. 3E). 100 out of 116 target genes (∼86%) are derepressed in both shRing1b and shMed12 mESCs.