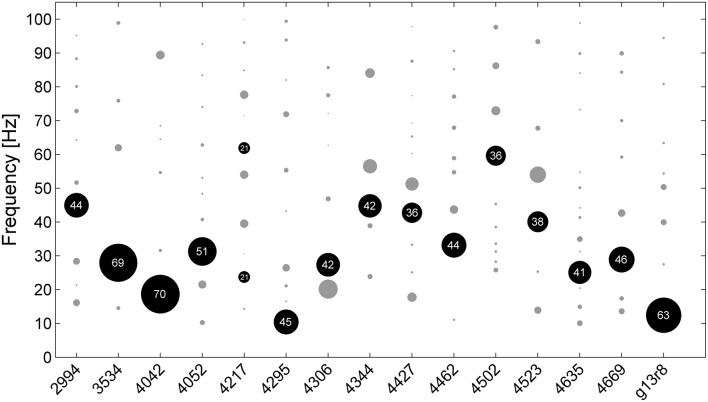
Figure 2.
Frequencies of the best fitting pulsesS for all analyzed chunks of undirected song for all 15 birds (bird ID numbers depicted on x-axis). Circles indicate frequency clusters as determined by hierarchical clustering analysis. Circle size corresponds to the percentage of chunks in the cluster relative to all chunks from the respective bird. The cluster containing the most chunks for each bird is black, the number inside the circle indicates the percentage of chunks within that cluster.

