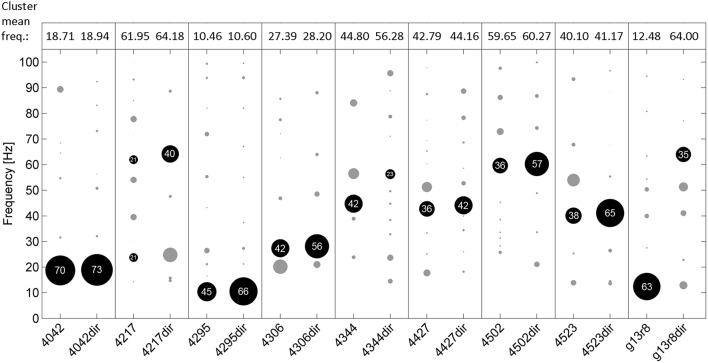
Figure 4.
Frequencies of the best fitting pulsesS for all analyzed chunks of undirected (left in each box) and directed song (right, e.g., “4042dir”) for 9 birds. Circles indicate frequency clusters as determined by hierarchical clustering analysis. Circle size corresponds to the percentage of chunks in the cluster relative to all chunks from the respective bird and condition. The cluster containing the most chunks for each bird and condition is black and the percentage of chunks in that cluster is given. Mean frequency of those clusters is shown on top of the figure.

