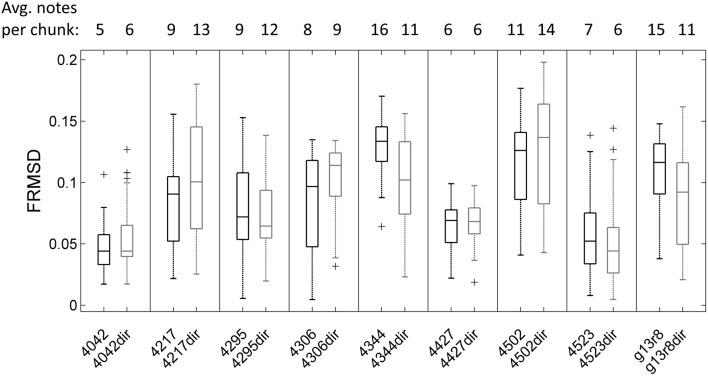
Figure 5.
Boxplot of frequency-normalized root-mean-square deviation (FRMSD) of note onsets to pulseS for all undirected (left in each box) and directed song chunks (right in each box, e.g., “4042dir”) of 9 birds. Outliers are marked by crosses. There was no significant difference in FRMSD between undirected and directed song (LMM; p > 0.05 for all 9 birds). Note that FRMSD increases with the number of notes in the chunk (Supplementary Figure 3), which was accounted for in the linear mixed model.

