
Figure 3.
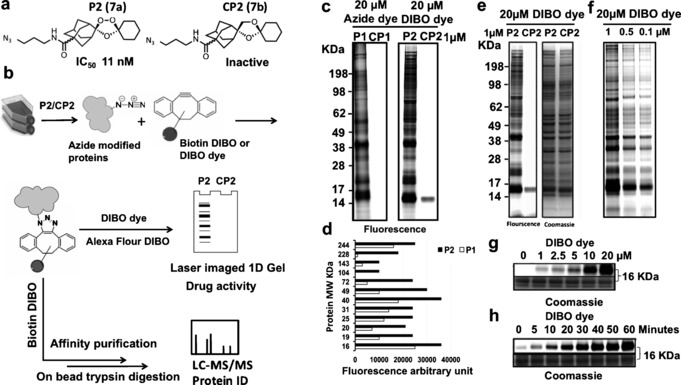
Labeling of parasite proteins (P. falciparum, 3D7 strain) using 7 a. a) Chemical structure of ozonide azide probe (P2 (7 a)) and deoxyether analogue (CP2 (7 b)) and their antimalarial activity against P. falciparum 3D7. b) General workflows of copper‐free click methodology for in situ parasite protein identification using azide trioxolanes probes as detailed mentioned in methodology section. c) Fluorescence image of 1D gel for proteins labeled in situ with alkyne probes (P1 (6 a) and CP1 (6 b)) vs. azide probes (P2 (7 a) and CP2 (7 b)), note that no labeling occurs with negative control alkyne (CP1 (6 b)) and azide control (CP2 (7 b)). d) Arbitrary fluorescence intensity measurements of the major protein bands labeled and identified with 20 μm Alexa flour 488 azide for parasite proteins tagged with 1 μm of alkyne probe (P1 (6 a)) vs. proteins tagged with 1 μm of azide probe (P2 (7 a)) identified with 20 μm Click‐IT Alexa Fluor 488 DIBO Alkyne. Fluorescence arbitrary units reveal higher sensitivity in case of bio‐orthogonal copper free click reaction, that is, P2 (7 a) treatment. e) Gel image of P2 (7 a) treatment vs. control, pre and post coomassie stain with equal protein loading. f) Fluorescence image representing probe titration from 1 to 0.1 μm P2 (7 a) probe; proteins identified via copper free click reaction with Click‐IT Alexa Fluor 488 DIBO Alkyne. No changes were observed in labeling profiles of the trioxolane‐tagged proteins with concentrations relevant to pharmacological concentration of the drug (100 nm). g) Titration of DIBO dye at various concentrations up to 20 μm for parasite treated in situ with 1 μm P2 (7 a). h) Time dependent increase of fluorescence signal for proteins tagged with 1 μm P2 (7 a) and 20 μm Click‐IT Alexa Fluor 488 DIBO Alkyne indicating that the maximum band intensities could be achieved after 1‐hour of click reaction incubation.