
Figure 4.
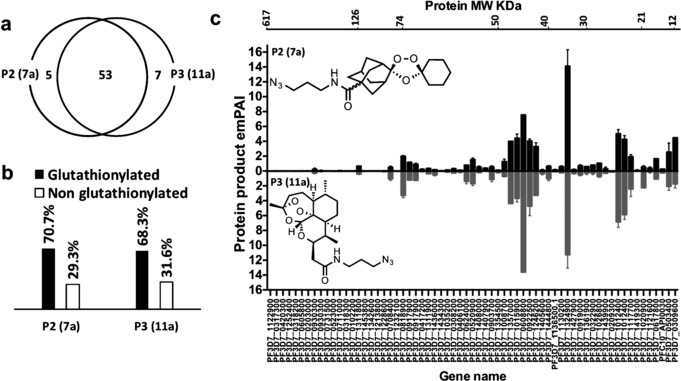
Mass spectrometry experiments with azide trioxolane azide probe (P2 (7 a)) vs. artemsinin azide probe (P3 (11 a)). a) Venn diagram demonstrating overlap between proteins identified with the endoperoxide probes, P2 (7 a) and P3 (11 a) respectively. (b) Percentage of the glutathionylated proteins, which contains the GSH binding motif that was identified with endoperoxides probes P2 (7 a) and P3 (11 a) in light of Kehr et al.11 (c) Head to head comparison between proteins identified with P2 (7 a) vs. P3 (11 a). Proteins sorted according to their molecular weight from high to low. Errors bars represented the standard deviation for protein quantity in each treatment calculated by dividing the exponentially modified protein abundance index (emPAI)16 for each protein by the total emPAI values (each treatment contain two replicate, for accuracy each replicate is the average of four injections into the Orbitrap LC‐MS/MS instrument).