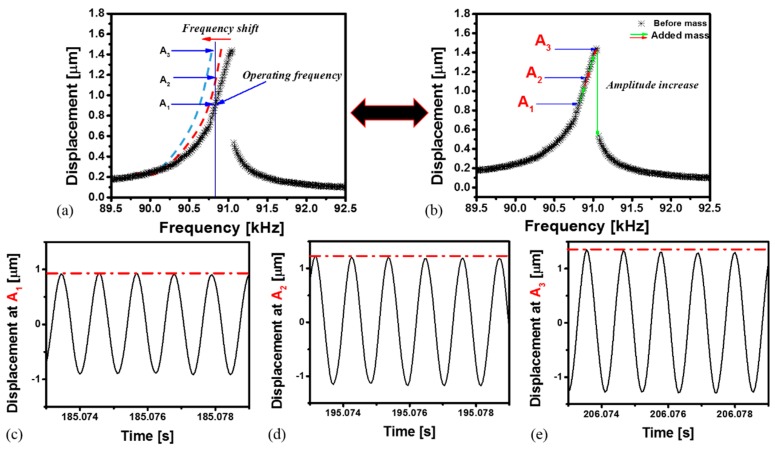
Figure 8.
Mass quantification concept at different vapor exposure steps. (a) Frequency response curves before (experimental, black stars) and after vapor exposure (schematic, dashed). The vertical line indicates a fixed operating frequency of the resonator during vapor exposure. Clearly, the amplitude of the resonator increases with the absorption of vapor; (b) The same experiments in (a) can be viewed based on a single frequency-response curve before vapor exposure. Vapor absorption can be viewed as riding the upper branch of the frequency response curve; (c–e) Measured time history showing the displacement at (c) point A1; (d) point A2 and (e) point A3.

