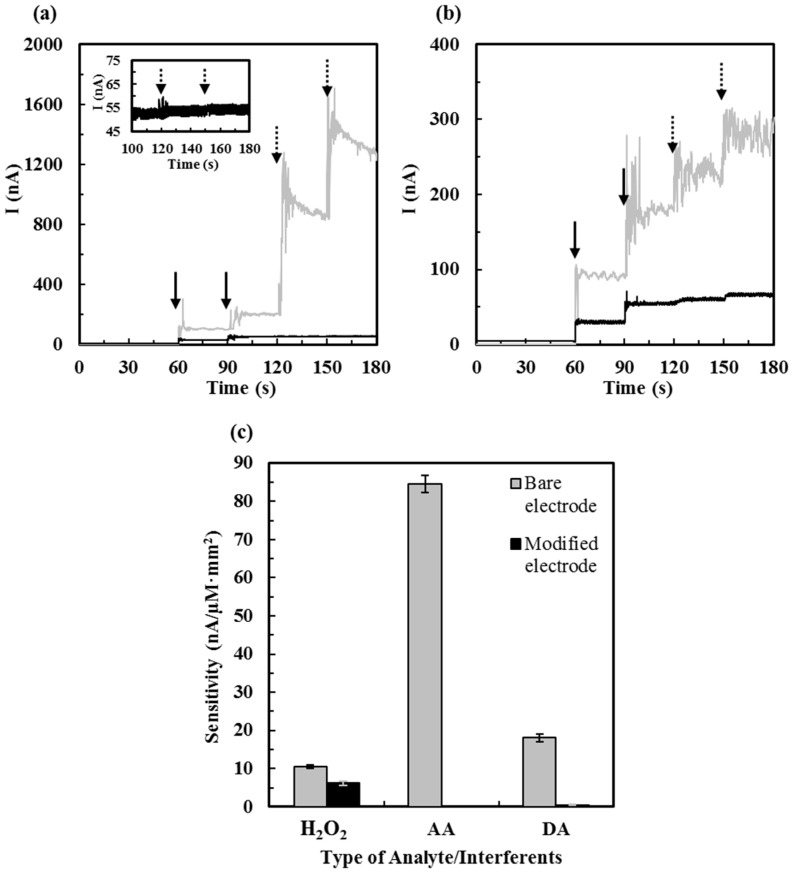
Figure 7.
The effect of interference tested on bare Pt electrodes and ALT biosensors. (a) Current responses upon sequential additions of 20 µM and 40 µM H2O2 (the injection of H2O2 is indicated by the solid black arrow) and 250 µM and 500 µM AA (the injection of AA is indicated by the dashed black arrow) tested on bare Pt electrodes (━ gray line) and ALT biosensors (━ black line). The inset plot shows lower current range; (b) Current responses upon sequential additions of 20 µM and 40 µM H2O2 (the injection of H2O2 is indicated by the solid black arrow) and 5 µM and 10 µM DA (the injection of DA is indicated by the dashed black arrow) tested on bare Pt electrodes (━ gray line) and ALT biosensors (━ black line); (c) Comparison of interferent current responses tested on bare Pt electrodes and ALT biosensors (N = 5).

