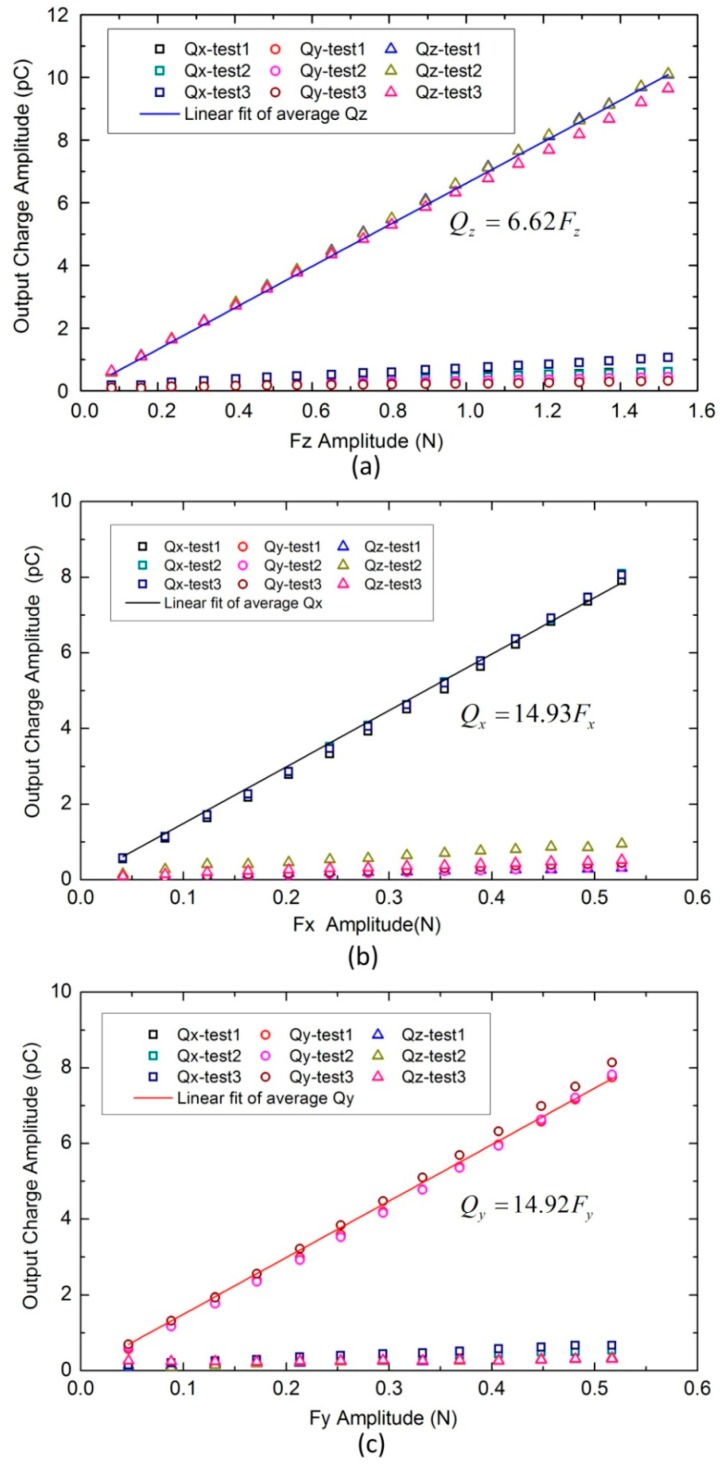
Figure 7.
Average amplitudes (100 wave periods) of sinusoidal output charges versus sinusoidal input forces (20 Hz). In which symbols ‘□’, ‘○’, ‘△’ represent combinational output charges , respectively. Each symbol has three colors indicating responses from three repeated tests. Solid lines represent linear fit of average response of the three repeat tests. (a) z-axis; (b) x-axis; (c) y-axis.

