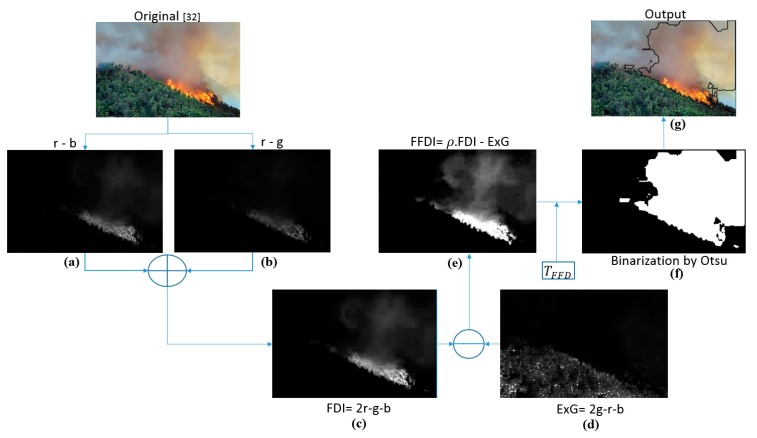
Figure 3.
Diagram showing the forest fire detection process with color indices. Calculation of: (a) r minus b; (b) r minus g; (c) FDI (Fire Detection Index); (d) ExG (Excess Green colors) and (e) FFDI; (f) binarization; (g) detected fire region. The original image in this figure was taken from [32].

