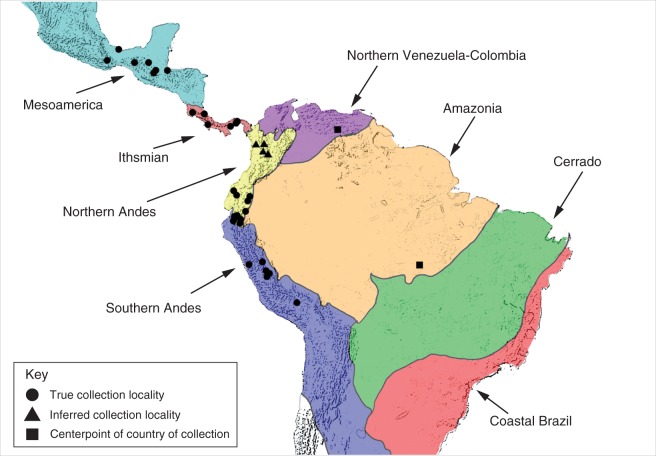
Fig. 4.
Depiction of the eight biogeographic regions as described by Gentry (1982). Points indicate the collection localities of all sampled (79) individuals for which we obtained scent profile data. Circles represent the true collection localities, whereas triangles represent inferred collection localities based on species distributions and type localities (Jenny, 1993). Squares represent the mid-point of the country of collection and are used for two individuals for which precise locality data were not available; these two individuals could not be unambiguously assigned to a single biogeographic region. Table 2 provides the distribution of fragrance groups and species within each biogeographic region.

