
Fig. 5.
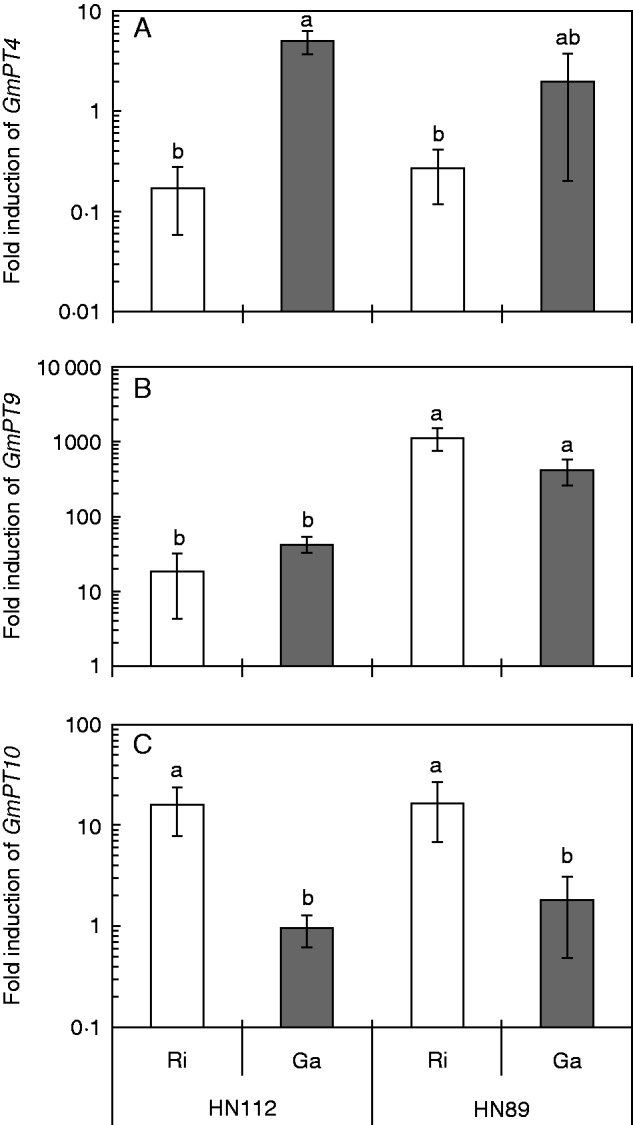
Expression of the high affinity Pi transporter genes GmPT4 (A), and the two mycorrhiza-inducible plant Pi transporter genes GmPT9 (B) and GmPT10 (C) in mycorrhizal roots of the two soybean genotypes HN112 and HN89 after inoculation with Rhizophagus irregularis (Ri) or Glomus aggregatum (Ga). Shown in the figures are the means of three biological replicates ± s.e.m. Different letters on the bars indicate significant differences among different AM treatments and soybean genotypes according to Duncan’s multiple comparison test (P ≤ 0·05). ANOVA results are shown in Table S5. Values <1 represent a decrease and values >1 an increase in transcript levels relative to the NM control.