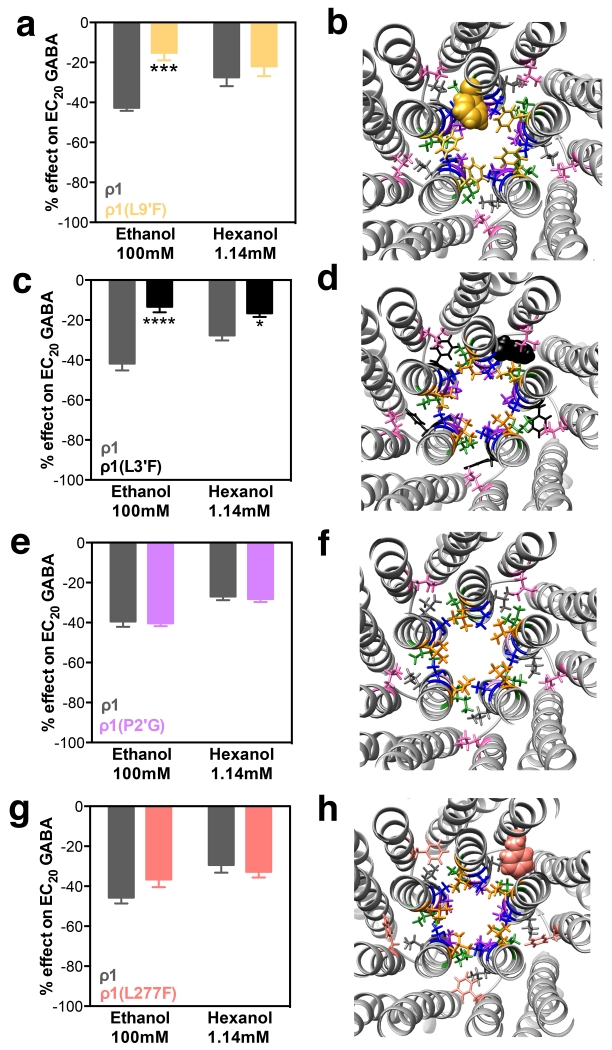
Figure 5.
Neighboring ρ1 mutants in TM2 and TM1: alcohol effects and molecular models. Left panels show ethanol (100 mM) and hexanol (1.14 mM) effects on EC20 GABA responses. Right panels are molecular models of the pore and TM domains of the corresponding ρ1 mutant, viewed from the plane between the extracellular and the TM domains. The graph bars and the corresponding amino acid in the model are the same color. A and B, L9’F; C and D, L3’F; E and F, P2′G; G and H, L277F. Bars represent means ± SEM, n= 3-5. Two-way ANOVA, Sidak’s multiple comparisons test: *p< 0.05, ***p≤ 0.001, ****p≤ 0.0001.

