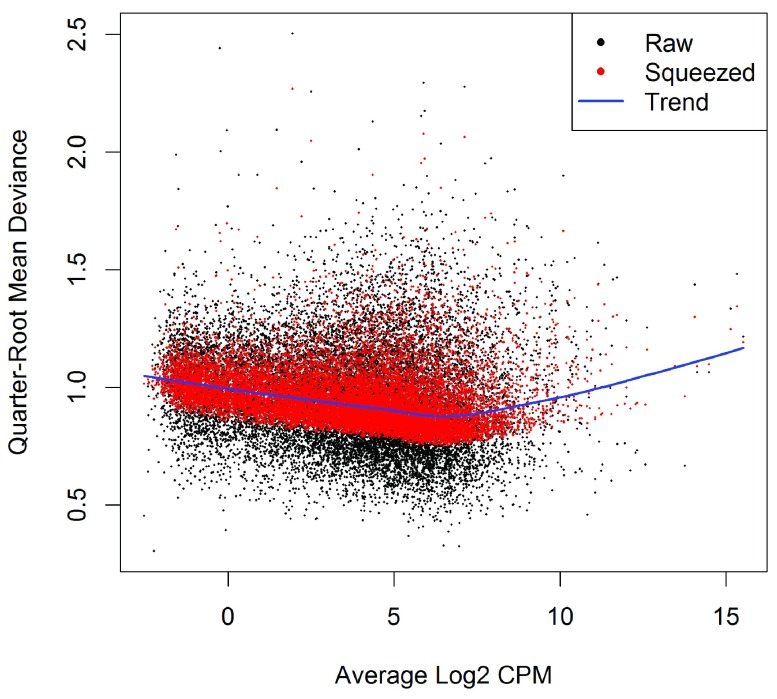
Figure 5. A plot of the quarter-root QL dispersion against the average abundance of each gene.
Estimates are shown for the raw (before EB moderation), trended and squeezed (after EB moderation) dispersions. Note that the QL dispersions and trend shown here are relative to the NB dispersion trend shown in Figure 4.

