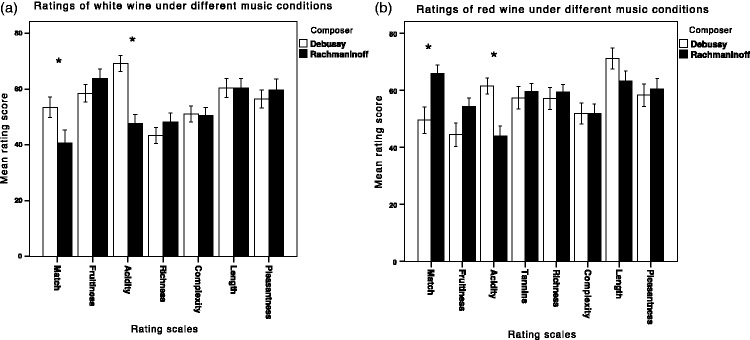
Figure 2.
Mean rating scores of wine–music match, fruitiness, acidity, richness, complexity, length, and pleasantness for the white wine (a) and red wine (b), under both music conditions in the main experiment. Note that each scale was 100 mm long, with 0 corresponding to the midpoint of the scale. Scale ratings for all the scales were converted from the range of −50 mm to 50 mm to a score of 0 to 100, as shown on the y-axis. The error bars represent the standard error of the means. Asterisks mark significant differences (p < .05) between music conditions.

