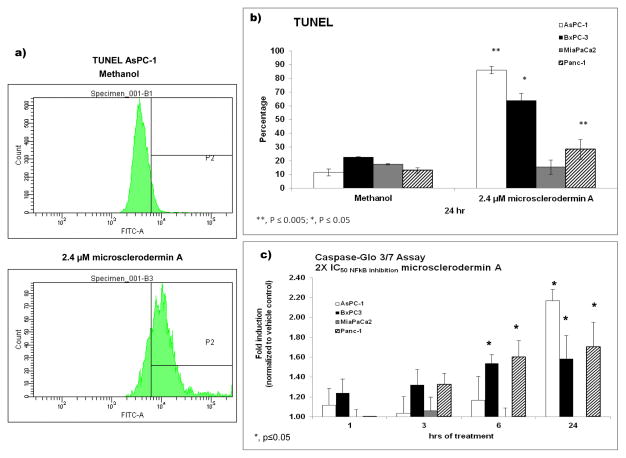
Figure 3. Induction of apoptosis by microsclerodermin A in pancreatic cancer cells.
a) Flow cytometry histograms from one representative experiment for TUNEL in AsPC-1 cells treated for 6 hours with vehicle control or 2.4 μM microsclerodermin A. b) Graphical representation of the flow cytometry data shows the average of 3 experiments ± standard deviation. Microsclerodermin A induced statistically significant apoptosis in the AsPC-1, BxPC-3 and PANC-1 cell lines. DNA fragmentation was not detected in the MIA PaCa2 cell line. c) Graphical representation of the caspase cleavage data showing the average of 3 experiments ± standard error of the mean. Caspase 3/7 cleavage was seen in the AsPC-1, BxPC-3 and PANC-1 cells as well, with increases in the amount of cleavage as the time of treatment was increased.

