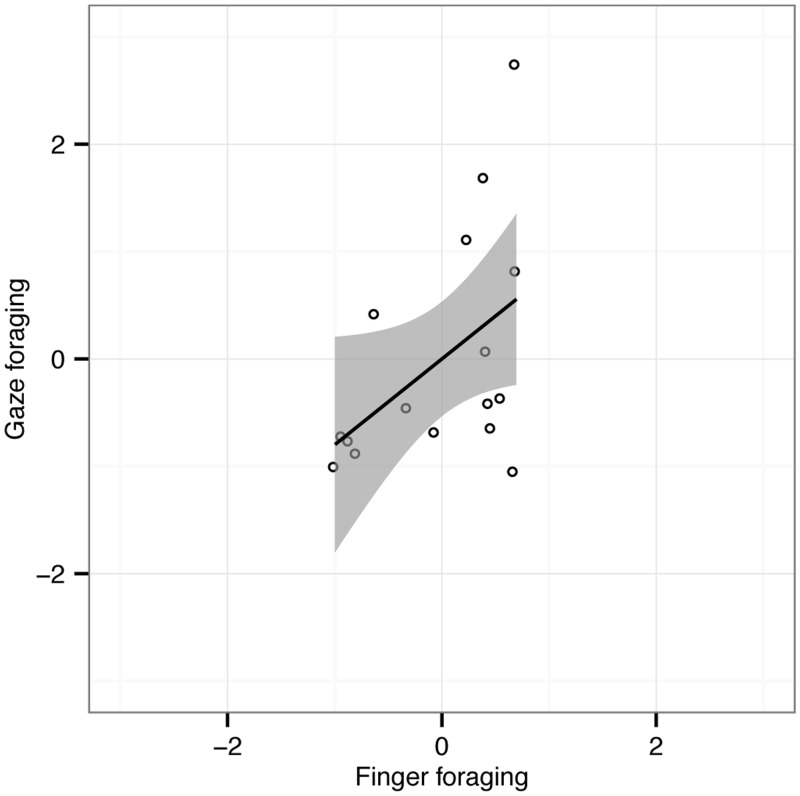
Figure 4.
Scatterplot showing normalized differences of mean run length between feature and conjunction foraging for gaze foraging (ordinate) and finger foraging (abscissa) for the 16 observers individually. The Pearson correlation (r) was .47 (p = .032, one-tailed). Shaded areas represent 95% CI of the linear fits to the data.

