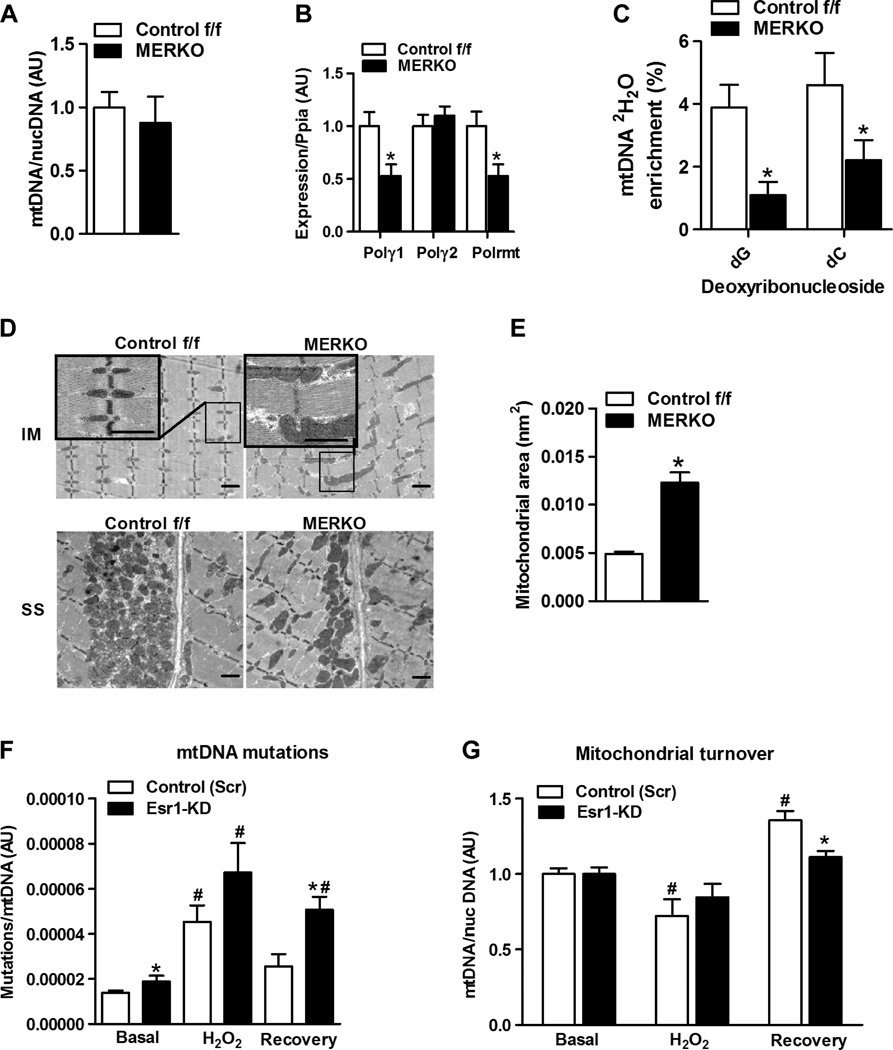
Fig. 4. Impaired mtDNA replication and altered mitochondrial morphology in MERKO muscle.
(A) Muscle mtDNA content, expressed as a ratio of mtDNA/nuclear (nuc) DNA (n = 8 per group). (B) Muscle polymerase γ1 (Polγ1), Polγ2, and Polrmt expression. (C) mtDNA replication as measured by 2H2O incorporation into newly synthesized mtDNA (deoxynucleosides, dG and dC) from Control f/f and MERKO mice (n = 6 per genotype). (D) Representative electron micrographs of soleus muscle from female Control f/f and MERKO mice, low- and high-magnification inset (IM, intramyofibrillar; SS, subsarcolemmal; scale bar, 1 µm). (E) Skeletal muscle intermyofibrillar mitochondrial area (n = 3 mice per genotype). (F) mtDNA mutation load was detected by random mutation capture (RMC) at basal (no treatment), after H2O2 treatment, and during recovery from H2O2 treatment. (G) mtDNA copy number at basal, after H2O2 treatment [in the presence of chloramphenicol (Chl) plus cycloheximide (Chx), and during recovery (in the presence of bafilomycin A1 (BafA1)]. All values are expressed as means ± SEM. Mean differences detected by Student’s t test and ANOVA where appropriate; *P < 0.05, between-genotype difference; #P < 0.05, within-genotype between treatment difference.

