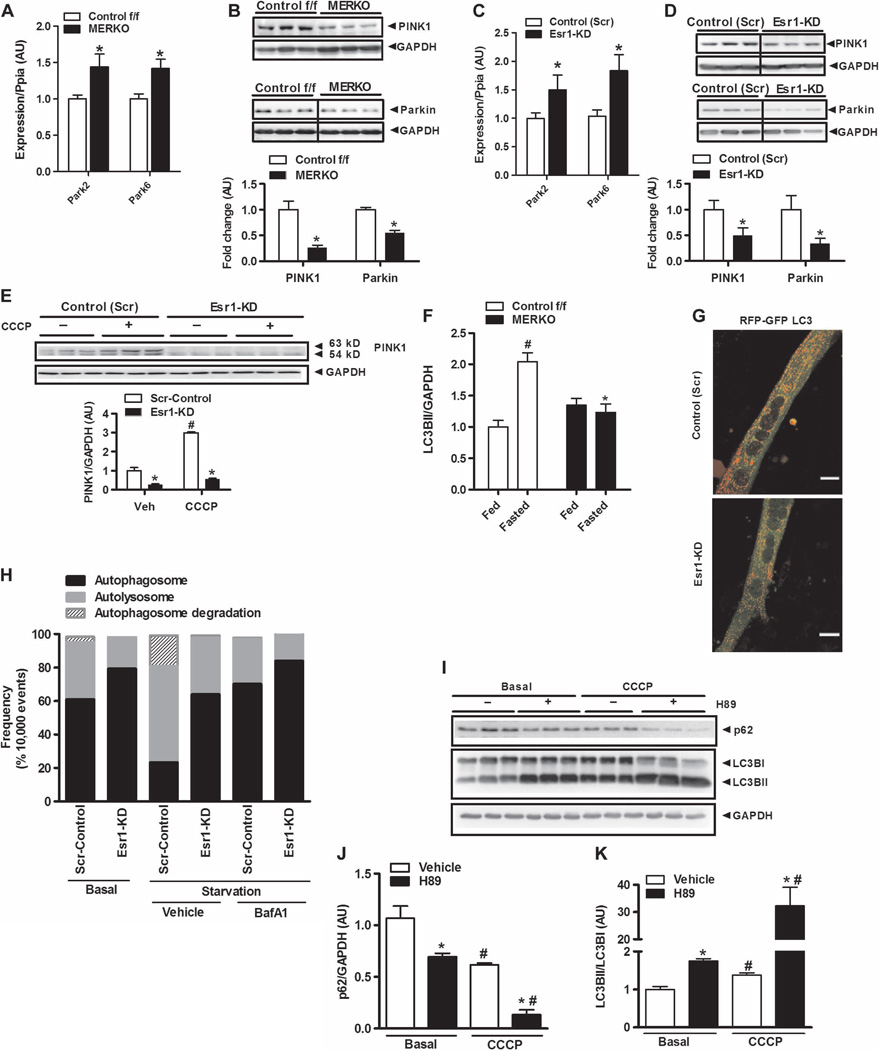
Fig. 6. ERαdeficiency impairs mitophagic signaling in muscle.
(A to D) Expression of Park family members (Park2 and Park6) in muscle from female Control f/f and MERKO mice (n = 6 per genotype, A and B) and C2C12 myotubes (n = 6 per group, C and D). (E) CCCP-induced accumulation of full-length (63-kD) PINK1 protein in control (Scr) and Esr1-KD myotubes (n = 6 observations per condition). Veh, vehicle (control). (F) Densitometric analysis of LC3BII protein levels in muscle from fed and fasted (24 hours) female Control f/f versus MERKO mice relative to GAPDH expression (n = 6 mice per condition). (G and H) Confocal microscopy and flow cytometry analyses of dually labeled RFP-GFP-LC3B expressed in control (Scr) and Esr1-KD muscle cells during nutrient deprivation. (G) Reduced red punctae were observed in Esr1-KD muscle cells versus Scr-control, indicating diminished autolysosome formation (scale bar, 1 µm). (H) To more accurately quantify fluorescence signals in muscle cells, flow cytometry analyses were performed in triplicate during nutrient deprivation in the presence and absence of BafA1 (10,000 live events quantified). Bars depicting quantification of dual signal represent autophagosome abundance (closed bars); a single RFP signal represents autolysosome abundance (gray bars); and cells showing loss of signal represent autophagosome degradation (hatched bars). (I to K) The impact of PKA inhibition (H89, 50 µM) on p62 protein levels and LC3B processing in ERα-replete myotubes in the absence or presence of CCCP (20 µM) to stimulate mitophagy (n = 3 per condition). (I) Representative immunoblots and (J and K) densitometric analyses. All values are expressed as means ± SEM. Mean differences detected by Student’s t test or ANOVA. *P < 0.05, difference between genotypes; #P < 0.05, within-group, between-treatment difference.

