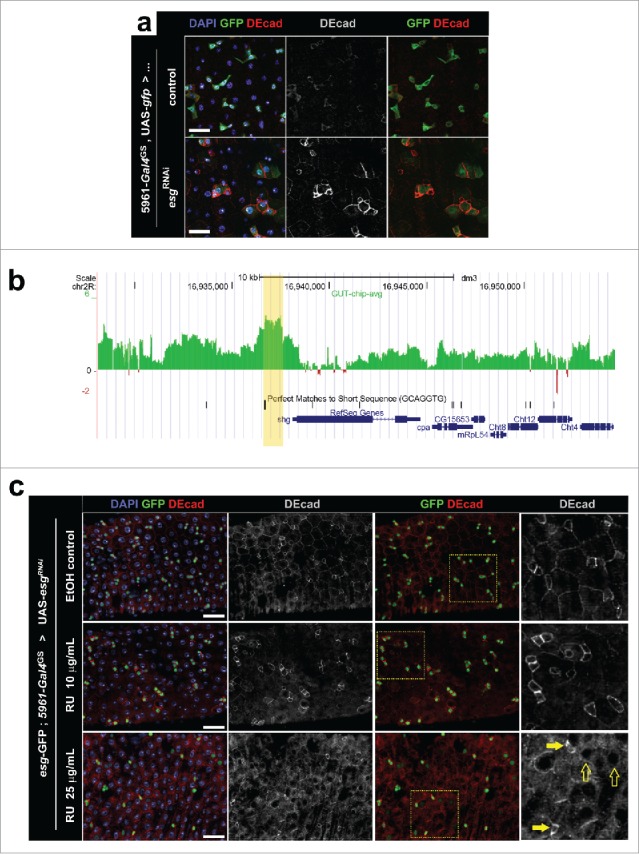
Figure 2.

(a) Immunostaining for DE-cad in posterior midguts following knockdown of Esg expression. Flies expressing a UAS-esgRNAi transgene under control of the ISC/EB specific driver 5961-gal4GS (“esgRNAi”) and control flies carrying only the Gal4GS driver (“control”) were kept for 4 d in food containing the inducer RU486 (10 μg/mL). Midguts were probed for GFP expression (ISC/EBs) and DE-cad, and all nuclei were stained with DAPI (as indicated). Scale bars = 20μm. (b) DamID data revealing a peak of Esg binding just upstream of shotgun (shg). DamID was used to map the binding of Esg to the genome; the x-axis corresponds to genomic coordinates in chromosome 2R, while the y-axis corresponds to extent of binding of an Esg:dam fusion construct to DNA in midguts (see ref. 4 for details). The yellow shade marks the Esg-bound region. Notice that the EBR contains a perfect match of the consensus Esg binding sequence. 49 (c) Immunostaining for DE-cad in posterior midguts following different degrees of Esg knockdown. Flies carrying a UAS-esgRNAi transgene under control of the ISC/EB specific driver 5961-gal4GS were kept for 3 d in food that contained only ethanol (EtOH control), or food containing a lower (10μg/mL) or higher (25μg/mL) dose of the inducer RU486 (as indicated). The tissue was stained as in (a) and all images were captured using the same acquisition times. Notice that these flies carried a separate esg-GFP reporter, which allows for ISC/EB identification in flies kept in EtOH control food. Rightmost panels are zoomed regions that correspond to the yellow boxes in the adjacent images. Full and empty arrows point to examples of progenitor cells that express higher and lower levels of esg-GFP respectively. Notice that cells that retain high esg-GFP expression maintain high levels of DE-cad expression. Scale bars = 40μm.
