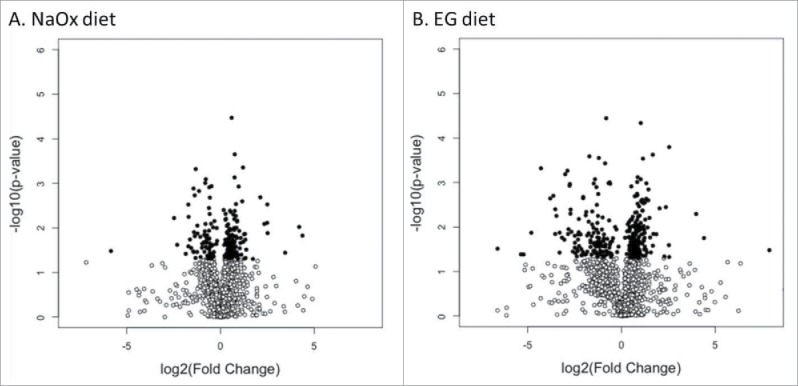
Figure 3A–B.

Volcano plot of differentially abundant proteins in Malpighian tubules after treatment. Volcano plots of protein fold changes for control vs. NaOx (A) and vs. EG group (B). The magnitude of the change is plotted on the x-axis (log2 of diet vs. control) against the significance of the change (-log10 of Progenesis P-values, which are equivalent to a 2-tailed Student's t-test of arcsinh-transformed normalized protein abundances) on the y-axis. Proteins were p< = 0.05 are highlighted in dark circles.
