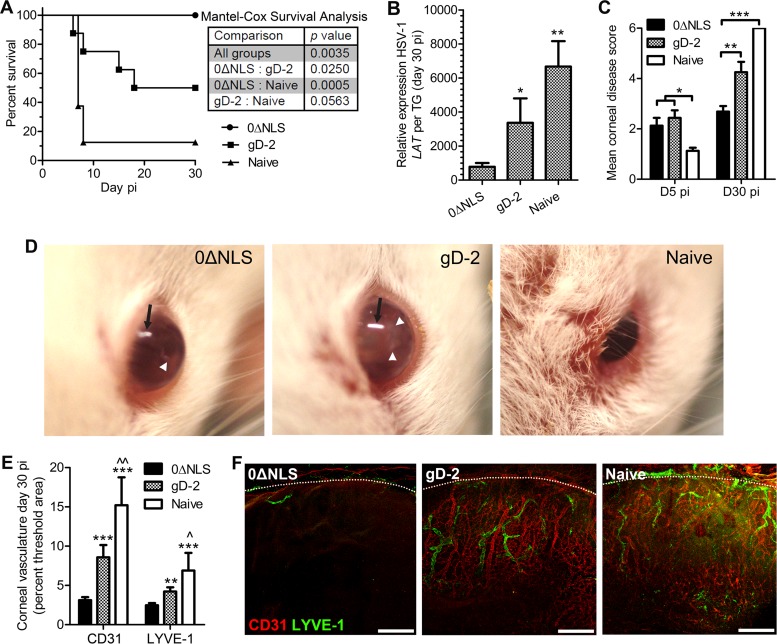
FIG 4.
Capacity of vaccine-mediated protection against a high-titer challenge inoculum. Vaccinated and naive mice were ocularly challenged with 50,000 PFU of HSV-1 and assessed for cumulative survival (A), viral latency in the TG at day 30 p.i. (B), and corneal opacity at days 5 and 30 p.i. (C). (D) Representative photographs of mice at day 5 p.i. showing signs of clinical disease. Black arrows indicate light reflection artifact, and white arrowheads pinpoint areas of corneal opacification; differences in the central versus peripheral opacification can be appreciated by comparing 0ΔNLS- and gD-2-immunized mice. Corneal neovascularization was assessed at day 30 p.i. in all groups. (E) Pathological corneal neovascularization evaluated by confocal microscopy in fixed immunolabeled cornea flat mounts taken from mice at day 30 p.i. The total area of CD31+ blood vessels and LYVE-1+ lymphatic vessels in the cornea quantified using MetaMorph software is shown. (F) Representative images of corneal neovascularization (magnification, ×10; scale bar, 200 μm). Dotted lines indicate the limbus, the naturally vascularized anatomic boundary circumscribing the healthy cornea. Data reflect two independent experiments with a total of 8 mice per group at days 0 and 5 p.i. and with 1 naive and 4 gD-2- and 8 0ΔNLS-immunized mice at day 30 p.i. Data shown exclusively reflect results with a 100× LD50 dose; data in all other figures reflect the standard LD50 challenge inoculum. Statistical differences were determined by one-way ANOVA with Student-Newman-Keuls multiple comparison tests for panel C and E and as described in the legend of Fig. 2 for LAT expression. Significance thresholds for all panels are indicated as follows: */^, P < 0.05; **/^^, P < 0.01; ***, P < 0.001. Unless indicated otherwise, significant differences in results relative to the 0ΔNLS- and gD-2-immunized groups are shown as asterisks and carets, respectively.

