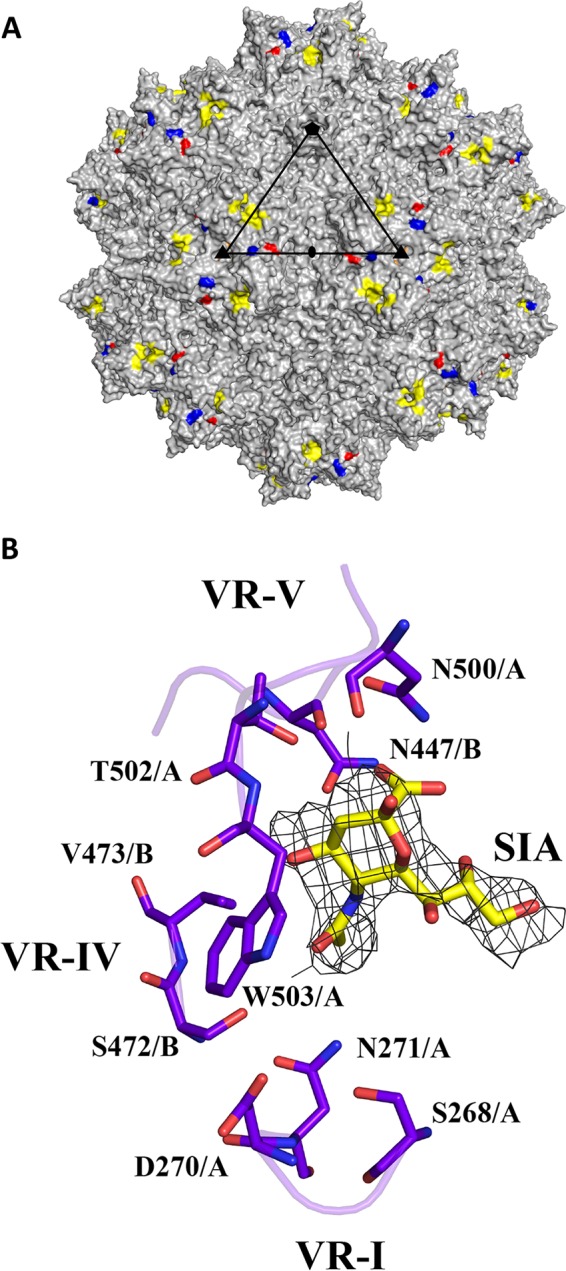
FIG 1.

SIA binding site on the AAV1 capsid. (A) Capsid surface image of AAV1 with the location of observed SIA density (yellow) and three surface-exposed residues that differ between AAV1 and AAV6: E531K (red), F584L (blue), and A598V (orange, not visible in the orientation shown). A viral asymmetric unit is depicted by a triangle (in black) bounded by two 3-fold (filled triangle) axes, divided by a line drawn through the 2-fold (filled oval) and a 5-fold (filled pentagon) axis. (B) Stick representation of a section of the AAV1-SIA crystal structure and predicted SIA interacting residues. The binding pocket is formed by two monomers with chains designated A and B. Some of the residues are located at two variable regions: (i) VR-I for S268, D270, and N271; (ii) VR-IV for N447, S472, and V473; (iii) VR-V for N500, T502, and W503. The electron density map of SIA is an averaged 2Fo−Fc map shown at a sigma threshold of 2.0 with radius cutoff (carve) of 1.9 Å. This figure was generated using the PyMOL program (52).
