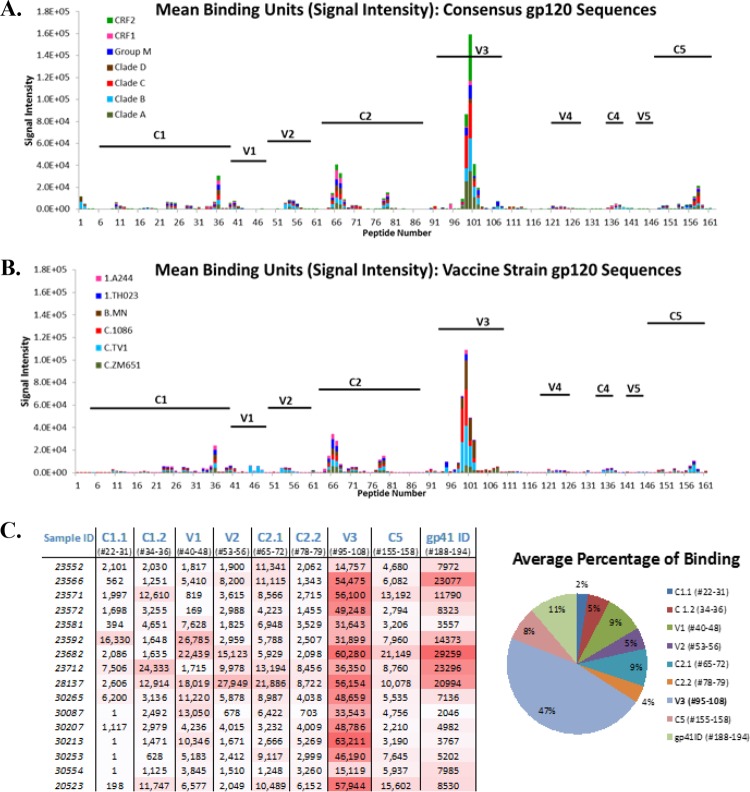
FIG 3.
Mapping of serum IgG binding to gp120 linear epitopes by peptide microarray. (A, B) Representative plots of gp120 binding in the serum of an immunized animal binding to either consensus gp120 sequences or vaccine strain gp120 at the serum IgG response peak (2 weeks after the last immunization). The values on the x axis are peptide numbers in the array library. Those on the y axis are signal intensities (baseline subtracted). Differently colored bars represent the different strains/clades indicated. The variable (V) and constant (C) domains of gp120 are labeled in each panel. (C) Intensity of binding to each epitope identified in the animals. The definition of each epitope as the range of peptide numbers in the array library is listed under each epitope. Color coding highlights higher intensity in darker red. The pie chart shows the average binding to each epitope as a percentage of the total. Each pie slice represents the mean value for all of the animals of maximum binding to the specified epitope/sum of maximum binding of all of the epitopes.

