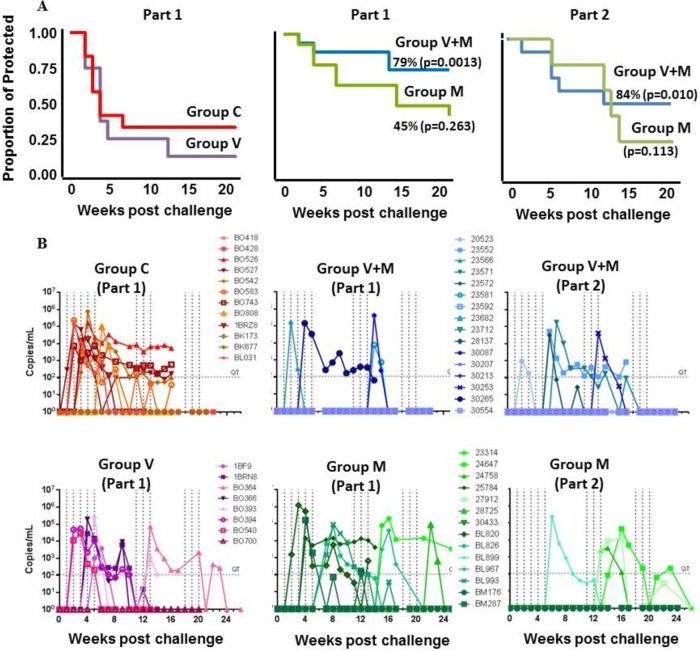
FIG 5.
Time-to-event survival analysis Kaplan-Meier curves and infection of macaques determined by RT-PCR in plasma. Groups: V, vaccine alone; V+M, vaccine plus microbicide; M, microbicide alone; C, control. (A) Kaplan-Meier plots of animals confirmed infected by RT-PCR. Red, control animals; purple, V group; blue, V+M group; green, M group. (B) Plasma viral loads of individual macaques during challenge phases. Vertical dotted lines indicate the dates of challenges; horizontal lines indicate the limit of quantification (300 copies/ml).

