FIG 9.
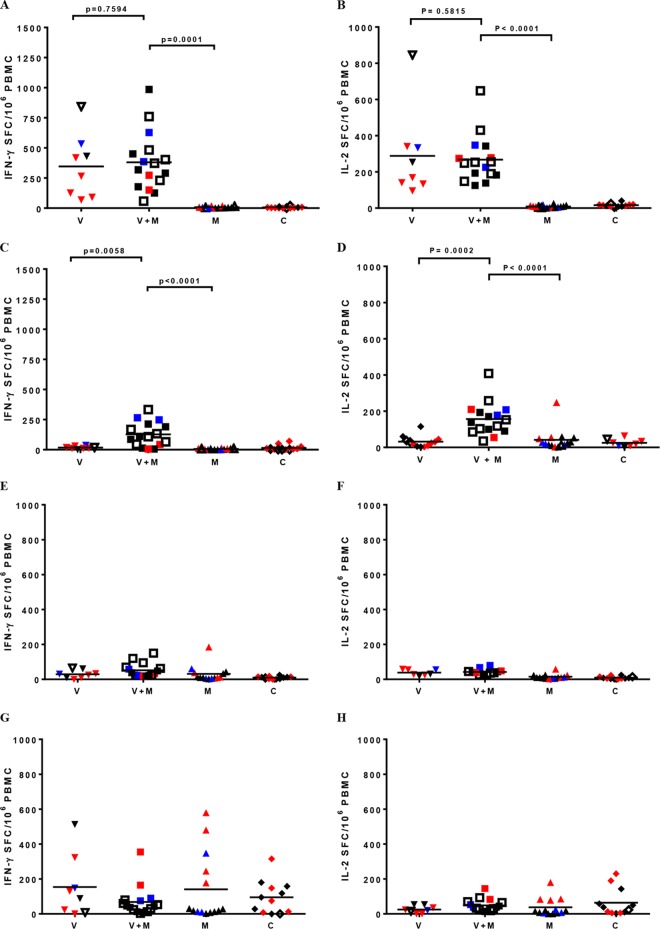
T-cell responses measured by ELISpot assay pre- and postchallenge. gp120-specific T-cell ELISpot assay responses in numbers of spot-forming cells/106 PBMC prechallenge (A, B) and after six challenges (C, D) and SIV Gag-specific T-cell ELISpot assay responses prechallenge (E, F) and after six challenges (G, H) are shown. Red symbols indicate infection during the first six challenges, blue symbols indicate infection during challenges 7 to 12 (weeks 11 to 21 postchallenge), and black symbols indicate infection during challenges 13 to 24. Empty symbols represent animals that were not infected. Solid lines indicate mean values. P values, where relevant following statistical analysis, are also shown.

