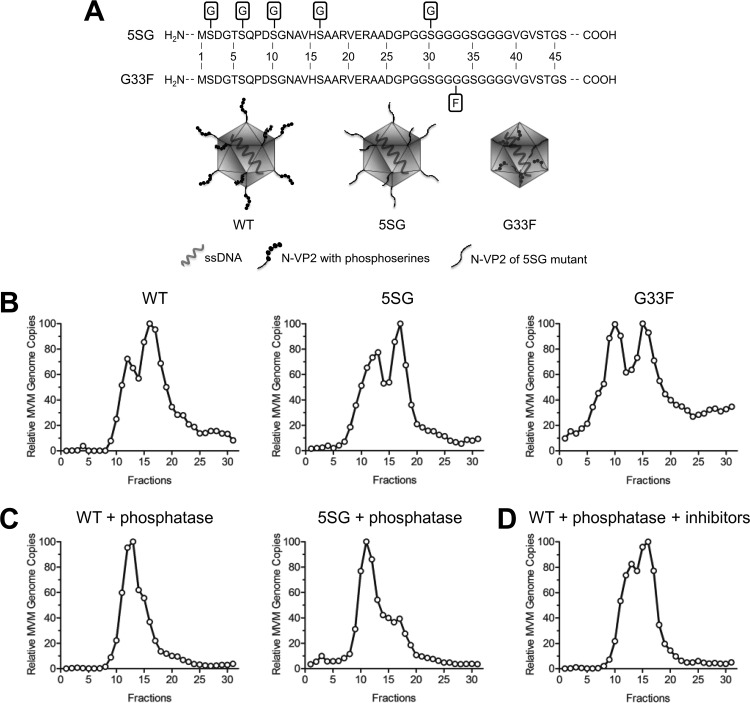
FIG 3.
The phosphorylation status of the capsid surface, aside from the phosphoserine-rich N-VP2, determines the distinct AEX profiles of FC-P1 and FC-P2. (A) Schematic representations of the wild-type (WT) virus and N-VP2 mutants. (B) Intracellular virus progenies from the WT and from the 5SG and G33F mutants were analyzed by AEX-qPCR. (C) Intracellular virus progenies from the WT and the 5SG mutant were treated with lambda phosphatase and were subsequently analyzed by AEX-qPCR. (D) AEX and phosphatase treatment in the presence of sodium orthovanadate and sodium fluoride.

