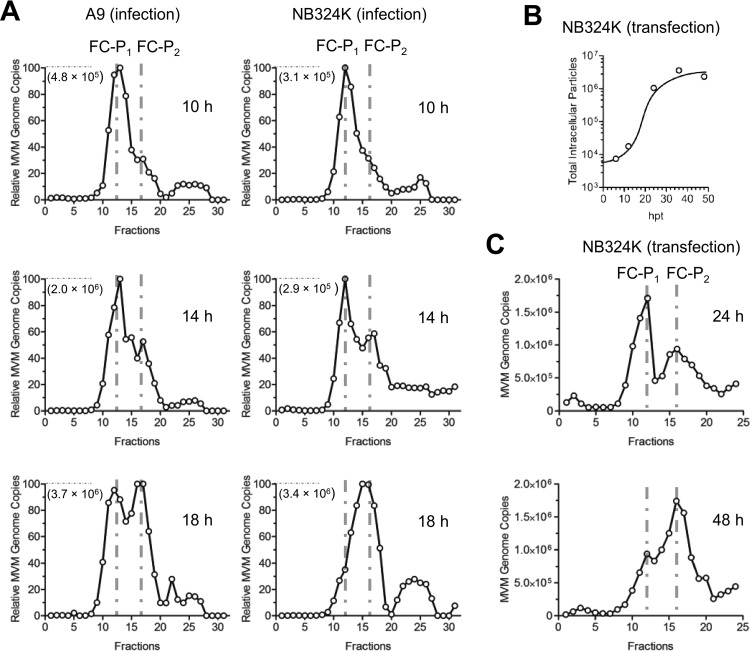
FIG 5.
Dynamics of FC-P1 and FC-P2 in infection and transfection. (A) A9 and NB324K cells (3 × 10⁶) were infected with 5,000 DNA-containing particles per cell at 4°C. After washing to remove unbound viruses, the cells were incubated at 37°C for the indicated times in the presence of neuraminidase and an anti-capsid MAb. Nuclei were isolated, and AEX-qPCR analysis was performed, as described in Materials and Methods. The genome copy number that corresponds to 100% is shown in each graph. (B) NB324K cells (106) were transfected in the presence of neuraminidase and an anti-capsid MAb. The intracellular progeny was immunoprecipitated with an anti-capsid MAb and was quantified by PCR at the indicated time points posttransfection. (C) NB324K cells were transfected as described above. Intracellular viruses were analyzed by AEX-qPCR at the indicated time points.

