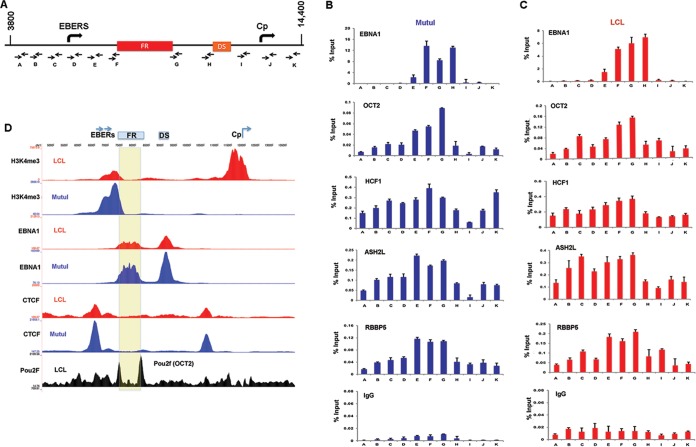
FIG 3.
OCT2 and HCF1 are enriched at OriP. (A) Schematic of EBV OriP region and positions of primer sets used for ChIP-qPCR. (B) ChIP-qPCR for EBNA1, OCT2, HCF1, ASH2L, RBBP5, and IgG control in MutuI cells. (C) Same as in panel B, except in LCLs. (D) ChIP-Seq tracks for H3K4me3, EBNA1, or CTCF are shown for LCLs (red) or MutuI cells (blue). OCT2 data set from ENCODE LCLs is shown in black. The FR region is highlighted in yellow.

