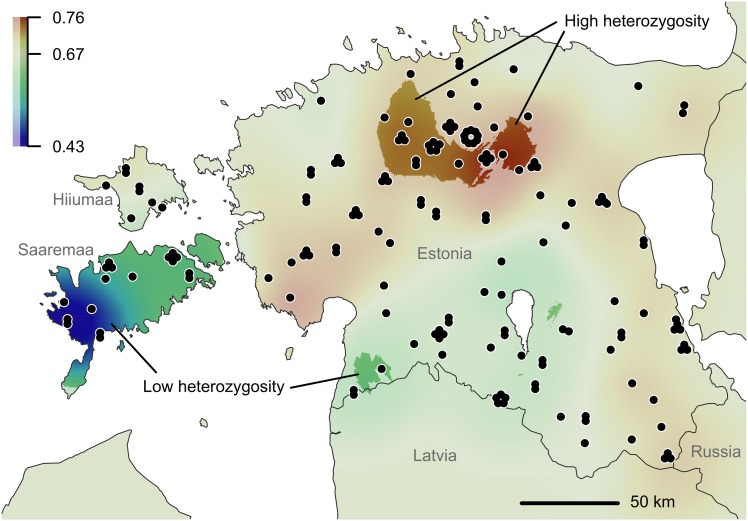
Fig 5. Spatial distribution of local average heterozygosity in Estonian wolf population.
Based on the proportion of heterozygous loci at individual level, statistically interpolated across the study area using procedure of universal kriging. The full colored areas represents statistically significant deviation from global median (0.67); p ≤ 0.05 according to 499 bootstrap iterations. The dots represent sample locations.

