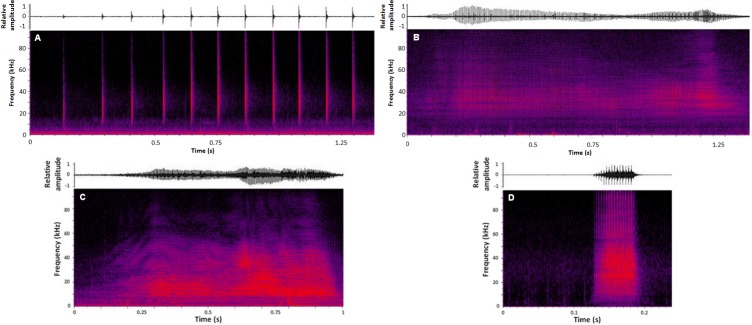
Fig 1.
Examples of pulsed signals produced by bottlenose dolphins in the Sado region, Portugal: (A) Slow click train, (B) Creak, (C) Squawk, (D) S-BP. The upper panels show sound waveforms, with relative amplitude on the y-axis, and the bottom panels show spectrograms for each signal type, with frequency (kHz) on the y-axis. Time (s) is on the x-axis. Spectrogram settings: FFT 512, Hann window, overlap 50%.

