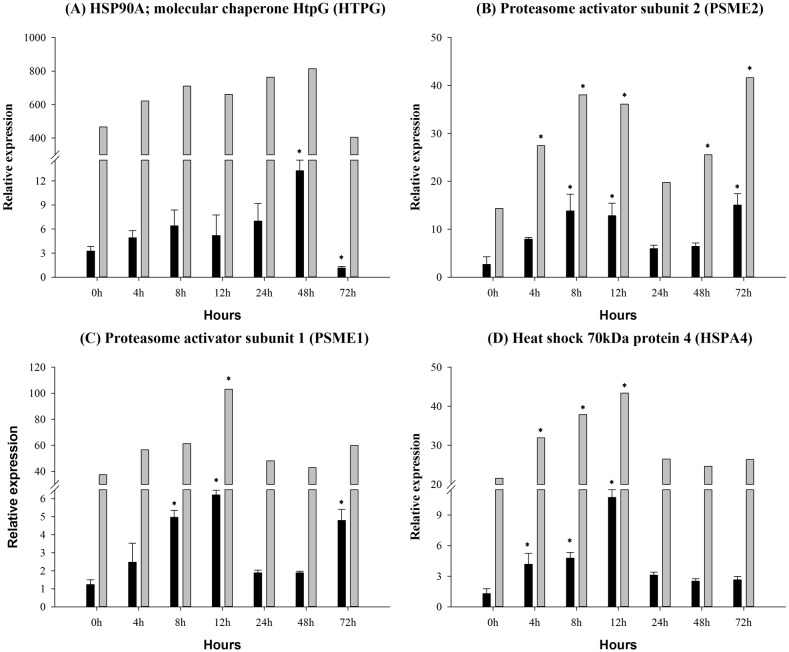
Fig 9. Antigen processing system gene expression in control and experimental group intra-peritoneal injection with 2.7×10⁷ CFU/mL (100 μL/fish) Aeromonas hydrophila, as determined by qRT-PCR.
(A) HTPG, (B) PSME2, (C) PSME1, (D) HSPA4. The black and the gray column represent selected gene and sequencing data, respectively. Values are presented as the mean ± SD (n = 6). The expression levels with * indicate significant differences with control group (p<0.05).

