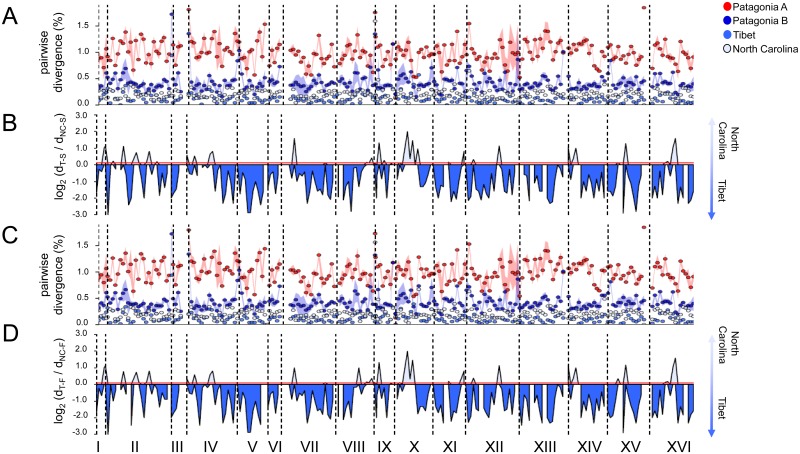
Fig 3. Genome-wide pairwise nucleotide sequence divergence to lager yeasts.
A) and C) are pairwise nucleotide divergence comparisons to a Saaz and a Frohberg representative, respectively. Comparisons are made to the Patagonia A population, the Patagonia B strains, the two North Carolina strains, and the Tibetan representative. Dots represent average values, while standard deviations from the average are represented by the colored shadow area; red for Patagonia A, dark blue for Patagonia B, blue for Tibet (T), and light blue for North Carolina (NC). B) and D) are the log2 ratios of the minimum NC-Lager divergence (dNC-X) and the T-Lager nucleotide divergence (dT-X) in 50-kbp windows, where X is B) Saaz (S) or D) Frohberg (F). log2 < 0 or >0 indicate whether that part of the genome is more closely related to T or NC, respectively. Red lines in B) and D) are significance thresholds established by permutation tests (unbiased P < 0.019). Regions lacking values are due to filters imposed based on coverage, data quality, or their absence in some strains (see S1 Text). Roman numerals represent chromosomes.

