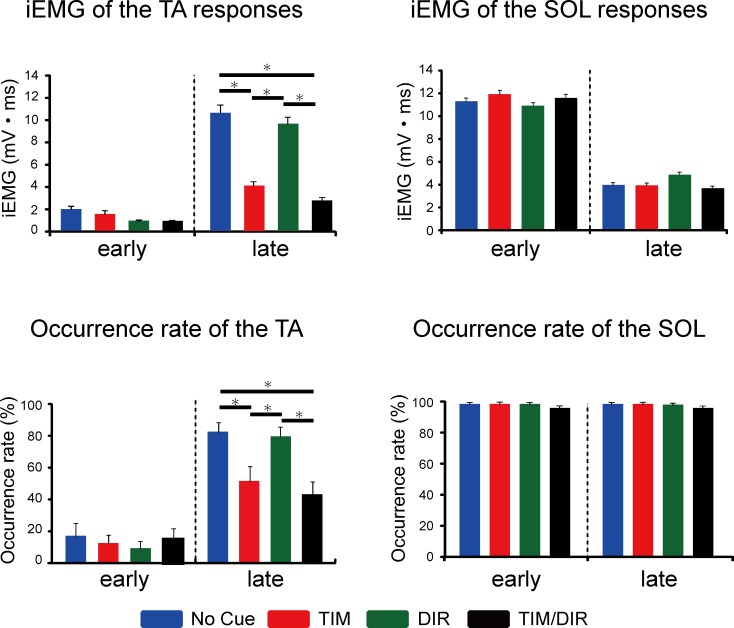
Fig 3. Comparisons of the iEMG and occurrence rate of each reflex component in the TA and SOL among the different cue conditions while standing.
The iEMG error bars indicate the SE of the mean value. The occurrence rate error bars indicate the SE of the mean value. *Statistically significant difference (p<0.05)

