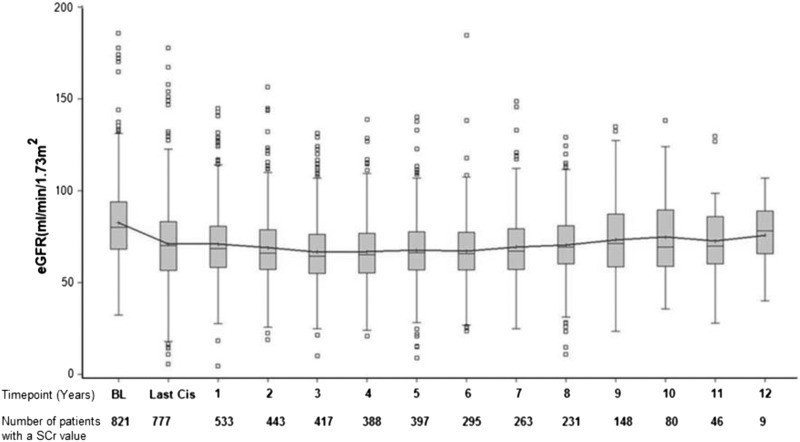
Figure 1.
Box plot (10th and 90th percentiles) of change in median eGFR (milliliters per minute per 1.73 m2) from baseline to year 12. Time points and numbers of total patients with a serum creatinine (SCr) at each time point are shown. Time points are in years. BL, baseline; Last Cis, at completion of the first cycle of cisplatin.

