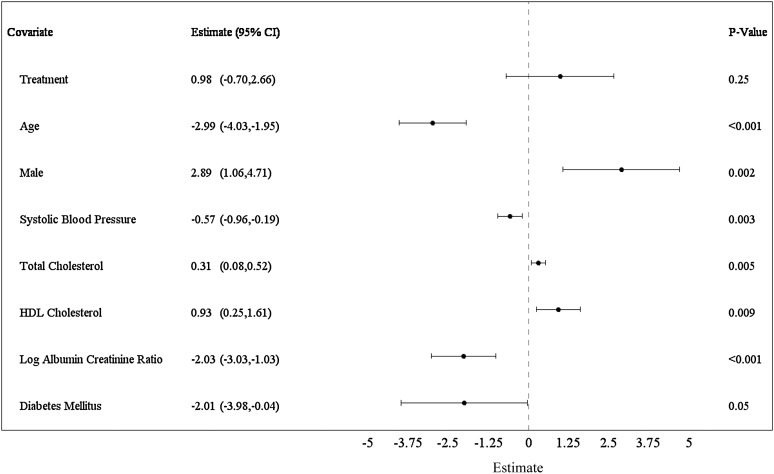
Figure 2.
Forest plot displaying a multivariate model for baseline covariates of eGFR (Chronic Kidney Disease Epidemiology Collaboration creatinine-cystatin C). All models were treatment and visit adjusted. Age, sex, and treatment were forced into the multiple variable model. Covariates were added to the model sequentially and kept in the model if the significance level was P<0.10 (n=713). Age is displayed per 10 years. Systolic BP is displayed per 10 mmHg. Total cholesterol and HDL cholesterol are displayed per 10-mg/dl units. Log of urine albumin-to-creatinine ratio is displayed per SD. Estimates are per mean follow-up of 1.84 years. 95% CI, 95% confidence interval.

