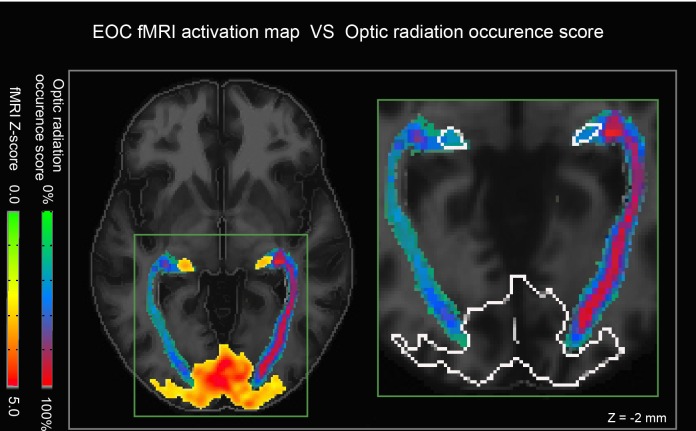
Fig 8. Validation of LGN segmentation.
(left) The red/yellow overlay represents fMRI activity during the EC-EO task. Note the widespread activation in the visual cortex and more focal bilateral activation in the thalamus (LGN). (right) An enhanced view shows that our reconstructed streamlines converge nicely onto the fMRI activation sites (outline in white).

